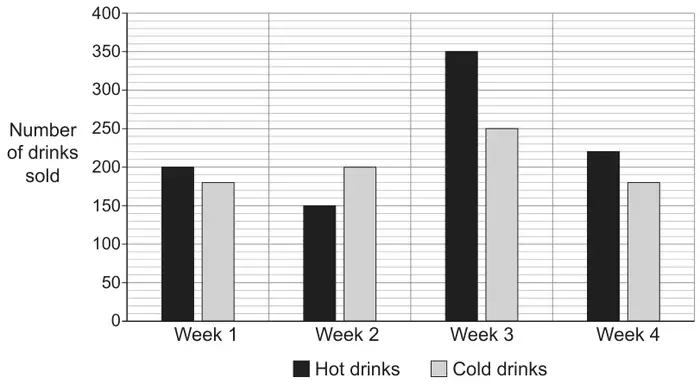
6. Jenny owns a drinks stand. The graph below shows the number of hot and cold drinks that she sold over a four-week period.
(a) Each hot drink costs £2.80 and each cold drink costs £1.35. What was the total income from selling drinks during week 1? [2]
(b)
What was the ratio of hot drinks to cold drinks sold during week 3? [2] Give your answer in its simplest form.
Hot drinks : Cold drinks = ………… : …………
(c) What percentage of the drinks sold during week 4 were cold drinks? [2]
(d)
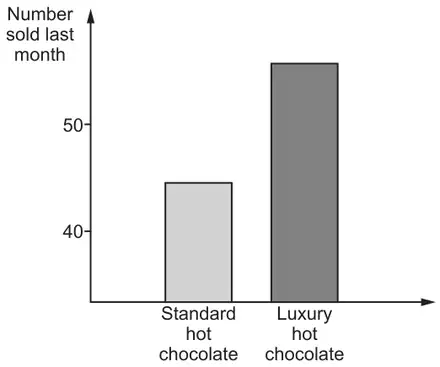
Jonathan owns a different drinks stand. He uses an advertisement to promote his luxury hot chocolate drink. This is shown below.
Luxury hot chocolate drinks are twice as popular as standard hot chocolate drinks.
Explain why the advertisement is misleading. [1]
Mark scheme (a)
Scheme
Marks
Comments
200 × 2.80 + 180 × 1.35
M1
560 + 243 May be seen in stages.
= (£) 803
A1
If no marks, award SC1 for one of the following:
A correctly evaluated total cost provided one of 200 or 180 is correct.
560 and 243 both calculated correctly but not added.
An answer of 774 (from 200 × 1.35 + 180 × 2.80)
Mark scheme (b)
Scheme
Marks
Comments
7 : 5
B2
B1 for sight of an equivalent ratio not fully simplified e.g. 35:25 B0 for 350:250
If no marks, award SC1 for 5 : 7
Mark scheme (c)
Scheme
Marks
Comments
\(\dfrac{180}{180+220}\) ( × 100) oe
M1
\(\dfrac{180}{400}\) ( × 100)
= 45 (%)
A1
If no marks, award SC1 for one of the following:
A correctly evaluated percentage provided one of 220 or 180 is correct.
An answer of 55(%) (percentage of hot drinks)
Mark scheme (d)
Scheme
Marks
Comments
A correct explanation that refers to the vertical scale e.g.
‘The scale does not start at zero, (so luxury hot chocolates sales are not double standard hot chocolate sales).’
‘Standard hot chocolates are around 45 and luxury hot chocolate sales are around 55, (they are not double).’ ‘There are only around 10 ( to 15) more luxury hot chocolates.’ ‘It would be around 90 luxury hot chocolates sold and it’s just over 50.’
E1
Allow e.g. ‘The bars show that it is double, but the numbers don’t.’
Do not allow e.g. ‘The numbers on the scale are not equally spaced.’ ‘Gaps are not consistent (on the vertical scale).’ ‘Not an accurate (vertical) scale.’ ‘We don’t know how much of each was sold.’ ‘The chart doesn’t show how many were sold.’ ‘It doesn’t have many numbers.’ ‘The numbers are not clear on the scale.’ ‘Doesn’t show exact sales.’ ‘Vertical axis is wrong.’
We'd like to use Google Analytics cookies to count visits and see which pages help most. They're optional, and the site works exactly the same either way. Privacy policy