
Numeracy Intermediate November 2024 Unit 1 Q4
4. Miss Hughes asked her class of Year 9 pupils and her class of Year 10 pupils how many minutes they each spent on their mathematics homework last weekend.
The frequency diagrams below show the results.
The groups used are as follows:
\(0 \leqslant \text{time} \lt 10\), \(10 \leqslant \text{time} \lt 20\), \(20 \leqslant \text{time} \lt 30\) and \(30 \leqslant \text{time} \lt 40\).
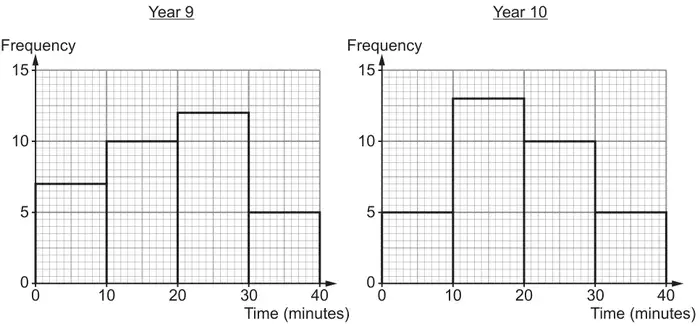
(a) What is the modal group of the times for the Year 9 pupils? [1]
(b) How many of the Year 10 pupils spent 20 minutes or more on their mathematics homework last weekend? [1]
(c) Did any of the Year 10 pupils spend no time on their mathematics homework last weekend?
Yes ☐ No ☐ Can’t tell ☐
You must give a reason for your answer. [1]
(d) Delyth calculates the following:
- the fraction of the Year 9 pupils who spent between 30 and 40 minutes on their homework
- the fraction of the Year 10 pupils who spent between 30 and 40 minutes on their homework.
Delyth says,
“These fractions are exactly the same.”
Is Delyth correct?
Yes ☐ No ☐
You must give a reason for your answer. [1]
| Scheme | Marks | Comments |
|---|---|---|
| 20 ≤ time in minutes < 30 | B1 | Allow e.g. ‘20 to 30’ ’20 – 30’ ’20 < time < 30’ ’20 ≤ time ≤ 30’ ’20 < time ≤ 30’ ’12 pupils for 20 to 30 minutes’ (implies the group) ’12 pupils in 20 – 30 minutes’ (implies the group) ‘12 (pupils), 20 – 30 minutes’ (2 answers side by side, mark the right-hand attempt) Sight of 20 and 30 with incorrect inequality signs, e.g. ‘20 ≤ 30’ Do not accept, e.g. ‘12’ ‘25’ ’20 – 30 minutes, 12 (pupils)’, (as a choice of answers, mark the right-hand attempt) |
| Scheme | Marks | Comments |
|---|---|---|
| 15 | B1 |
| Scheme | Marks | Comments |
|---|---|---|
| Unambiguously indicates ‘Can’t tell’ with a reason, e.g. ‘doesn’t give the raw data (for the group 0 to 10 minutes)’, ‘only know (frequency ) for the group 0 to (less than) 10 minutes’ ‘5 pupils spent less than 10 minutes, but the diagram doesn’t show if any of these spent no time’ ‘it doesn’t tell you exactly how many minutes each pupil spent individually’ | E1 | Allow ‘Can’t tell’ with a reason such as, e.g. ‘grouped data’, ‘data is grouped’ ‘it is given in a range on the diagram’ ‘it doesn’t show specifically’ ‘graph is not specific’ ‘it doesn’t given an exact time’ ‘the graph gives 0 to 10 minutes making it impossible to get an accurate reading’ ‘could be 1 minute each or 5 minutes each we don’t know’ (examples all within the group 0 ≤ time < 10) ‘doesn’t give the data for 0 minutes’ ‘because the group is from greater than or equal to 0 minutes to less than 10 minutes’ ‘graph does not say they did or not’ ‘we can’t see this on the diagram’ ‘does not give enough data’ Do not accept reasons that imply 0 minutes is not included in the diagram Do not accept, ‘Can’t tell’ e.g. ‘the groups are an estimate’ ‘could be 5 minutes each or 20 minutes each we don’t know’ (examples not all within the required group) ‘because the group is from greater than 0 minutes to less than 10 minutes’ ‘doesn’t tell us how many people there are’ |
| Scheme | Marks | Comments |
|---|---|---|
| Unambiguously indicates ‘No’ with a reason, e.g. ‘it is the same number (both 5 pupils) but different number of Year 9 asked to Year 10’, ‘the totals are different’, ‘Year 9 percentage is lower (than Year 10)’ ‘5/34 is not the same (percentage) as 5/33’ ‘there are more pupils in Year 9 (than in Year 10)’ ‘there are fewer pupils in Year 10 (than Year 9)’ | E1 | Check diagram for totals If ‘totals are different’ is stated or clearly implied, ignore any incorrect totals or fractions given, provided the numerator of 5 pupils is correct Alllow ‘No’ with a reason, e.g. ‘the difference is 1’ OR Allow ‘No’ with sight of total 34 for Year 9 and 33 for Year 10 Do not accept, e.g. ‘because the results are different’ ‘the difference is 2’ ‘there are more pupils in Year 10 (than in Year 9)’, unless the correct totals are seen ‘there are fewer Year 9 (than Year 10)’, unless the correct totals are seen |