21 A school is deciding on a charity to support. Each student at the school votes for one of four charities, A, B, C or D. The results are to be shown in a pie chart.
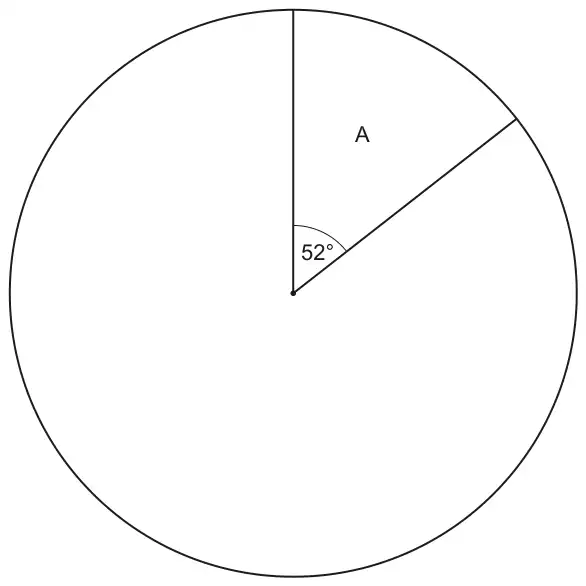
This pie chart shows the sector for charity A. Twice as many students voted for charity C than charity B. Twice as many students voted for charity D than charity C.
(a)
(i) Show that the sector for charity B will have an angle of \(44^\circ\). [2]
(ii) Complete the pie chart. [3]
(b) 39 students voted for charity A.
Calculate the total number of students at the school. [2]
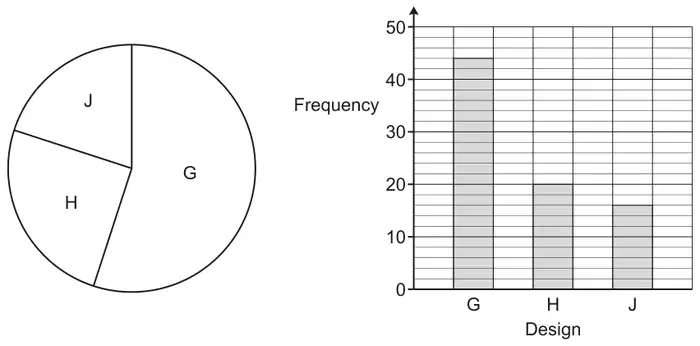
(c) The school asks 80 of the students to choose a new logo from three designs G, H and J. The same results are shown in a pie chart and in a bar chart.
(i) Give one advantage of using the pie chart rather than the bar chart. [1]
(ii) Give one disadvantage of using the pie chart rather than the bar chart. [1]
M1 for \(360 - 52\) or 308 or their\((360 - 52) \div (1 + 2 + 4)\)
Alternative method 1 : M2 for \(7x = 360 - 52\) or \(7x = 308\) then \(x = 44\) or M1 for \(x\), \(2x\) and \(4x\) or \(360 - 52\) or 308
Alternative method 2 : M2 for \(52 + 44 + 2 \times 44 + 4 \times 44 = 360\) oe or M1 for \(52 + 44 + 2 \times 44 + 4 \times 44\) oe
better includes \(308 \div 7\)
Mark the work in the answer space and if blank, mark any work round the diagram
Allow any letter
For M2 and M1 accept 88 for 2 x 44 and 176 for 88 x 2
(ii) Correct labelled pie chart with ruled lines and sector angles 44, 88 and 176
3
B2 for two additional correct sectors within tolerance or a correct unlabelled/incorrectly labelled pie chart with ruled lines or correct labelled pie chart with unruled lines or B1 for one correct sector within tolerance, ignore label
Use online protractor and apply an angle tolerance of \(\pm\) 2\(^\circ\). For 3 marks we need only four sectors and condone one sector unlabelled. Labels must be letters not angles
Mark scheme (b)
Answer
Marks
Part marks and guidance
270
2
M1 for any correct method e.g. \(\dfrac{39}{52} \times 360\) oe or \(39 + \dfrac{176}{\frac{52}{39}} + \dfrac{88}{\frac{52}{39}} + \dfrac{44}{\frac{52}{39}}\)
e.g. \(\dfrac{360}{\frac{52}{39}}\) or \(\dfrac{39}{52 \div 360}\) condone \(\dfrac{52}{39} = 1.3\)
Mark scheme (c)
Answer
Marks
Part marks and guidance
(i) Accept any correct advantage e.g. Information is immediately displayed as part of a whole
1
See appendix and mark best response as long as it is not contradictory or has an incorrect statement
(ii) Accept any correct disadvantage e.g. you cannot read the exact frequencies from it
1
See appendix and mark best response as long as it is not contradictory or has an incorrect statement
Appendix
Exemplar responses for Q21(c)(i)
Response
Mark
Information is immediately displayed as part of a whole
1
You can see the proportions easily
1
It shows proportions
1
Visual representation of proportions
1
Pie chart visually shows more than half the students voted G
1
It shows as a percentage of a whole
1(BOD)
Easier to tell the percentage of people who chose a design
1(BOD)
Easier to see percentage
1(BOD)
Easier to compare/ see results/ can see which one is most popular (or least popular)
0
Shows difference based on size of each part
0
Can easily compare size of sectors
0
Clear to see
0
Easier to read / understand
0
You can see the amounts compared to other amounts / can see biggest and smallest with a glance
0
It gives a better view on results
0
You can work out the percentage better
0
They give you a percentage whilst a bar chart doesn’t
0
It’s more accurate
0
Identify results quicker
0
Shows largest one without giving numbers
0
Exemplar responses for Q21(c)(ii)
Response
Mark
you cannot read the [exact] frequencies from it
1
It does not show frequencies/ the amount of people/ the number of students who chose which one
1
More difficult to work out how many students chose each logo