
Foundation November 2024 Paper 1 Q1
1 200 students at a school were asked how they travel to school.
The pictogram shows the results for four of the ways they travel to school.
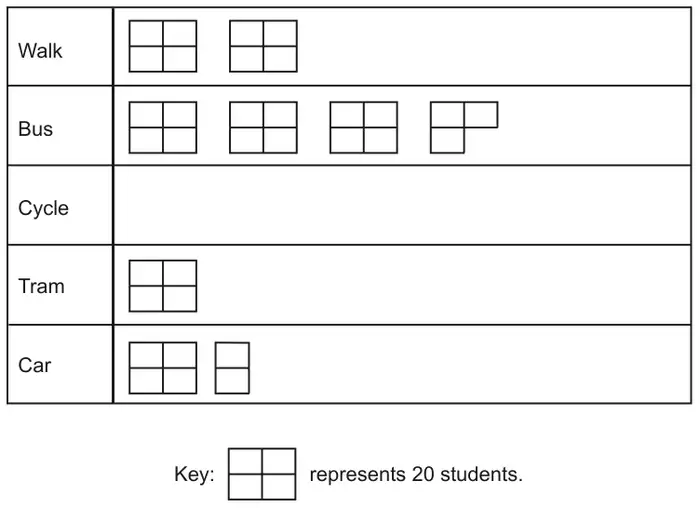
(a) How many students walk to school? [1]
(b) How many more students travel by car to school than travel by tram to school? [2]
(c) The rest of the 200 students cycle to school.
Complete the pictogram to show the number of students who cycle to school. [3]
(d) The total number of students at the school is 800.
What fraction of the students at the school were asked how they travel to school?
Give your answer in its simplest form. [2]
| Answer | Marks | Part marks and guidance | |
|---|---|---|---|
| 40 | 1 | ||
| Answer | Marks | Part marks and guidance | |
|---|---|---|---|
| 10 | 2 | M1 for 30 – 20 | Must see subtraction sign if answer incorrect |
| Answer | Marks | Part marks and guidance | |
|---|---|---|---|
 | 3 | B2 for 35 OR M2 for 200 – (40 + 75 + 20 + 30) or M1 for 40, 75, 20, 30 | 3 blocks in any orientation FT their values |
| Answer | Marks | Part marks and guidance | |
|---|---|---|---|
| \(\dfrac{1}{4}\) | 2 | M1 for \(\dfrac{200}{800}\) oe | isw incorrect cancelling |