
Higher November 2024 Paper 5 Q3
3 The graph shows the time, in minutes, taken by some pupils to travel to school on Tuesday.
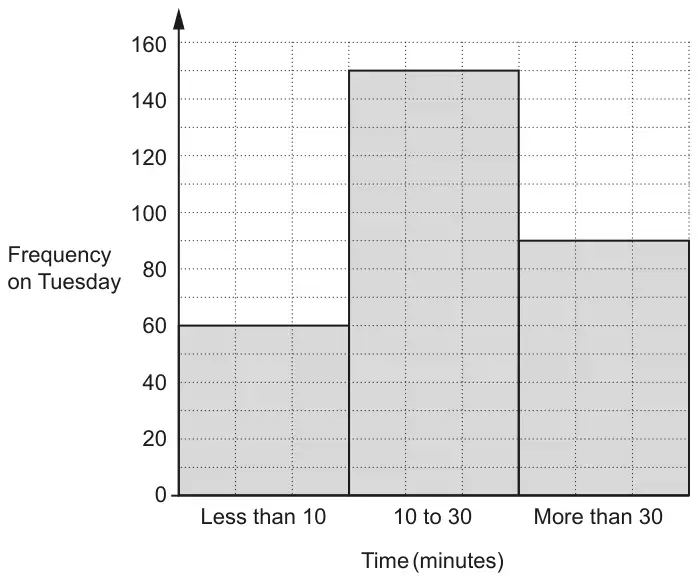
(a) Find the percentage of these pupils that took more than 30 minutes to travel to school. [3]
(b) On Tuesday the number of pupils taking 10 to 30 minutes to travel to school was 25% less than on Monday.
Find the number of pupils taking 10 to 30 minutes to travel to school on Monday. [3]
| Answer | Marks | Part marks and guidance | |
|---|---|---|---|
| 30 | 3 | M2 for \(\frac{90}{60 + 150 + 90}\) [× 100] oe or M1 for 60 + 150 + 90 oe seen | M2 implied by 0.3 oe M1 for 300 seen |
| Answer | Marks | Part marks and guidance | |
|---|---|---|---|
| 200 | 3 | M2 for \(150 \div \frac{100 - 25}{100}\) oe or M1 for \(\frac{100 - 25}{100}\) oe isw | M1 implied by 75%, \(\frac{75}{100}\) or 0.75 |