
Foundation November 2023 Paper 2 Q4
4 The bar chart shows the rainfall, in millimetres (mm), for a city in the first three months of the year.
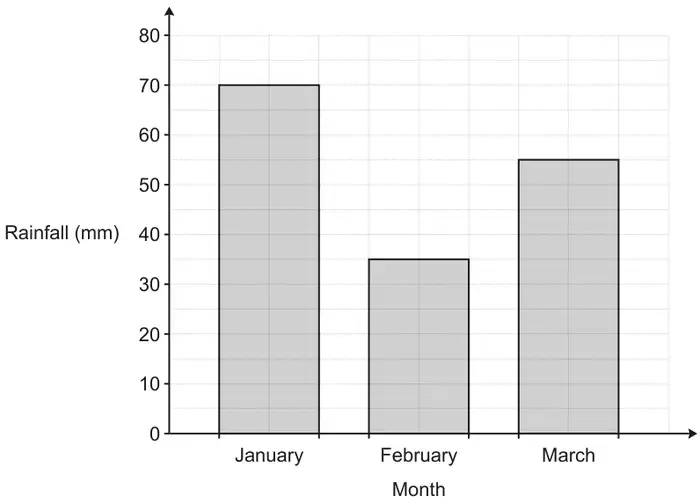
(a) Write down the amount of rainfall in February. [1]
(b) Write in its simplest form the ratio
amount of rainfall in February : amount of rainfall in March. [2]
amount of rainfall in February : amount of rainfall in March. [2]
(c) The total amount of rainfall in January and February was the same as the total amount of rainfall in March and April.
Work out the amount of rainfall in April. [3]
| Answer | Marks | Part marks and guidance | |
|---|---|---|---|
| 35 (mm) | 1 | ||
| Answer | Marks | Part marks and guidance | |
|---|---|---|---|
| 7 : 11 final answer | 2 | B1 for 35 : 55 or B1FT for their (a) : 55 or 35 : their 55 | Where their 55 is between 50 and 60 inclusive |
| Answer | Marks | Part marks and guidance | |
|---|---|---|---|
| 50 | 3 | M2 for 70 + their (a) – their 55 or M1 for 70 + their (a) If 0 scored SC1 for 70, 35 and 55 | M1 Implied by 105 SC could be seen on the graph or in parts (a) and/or (b) |