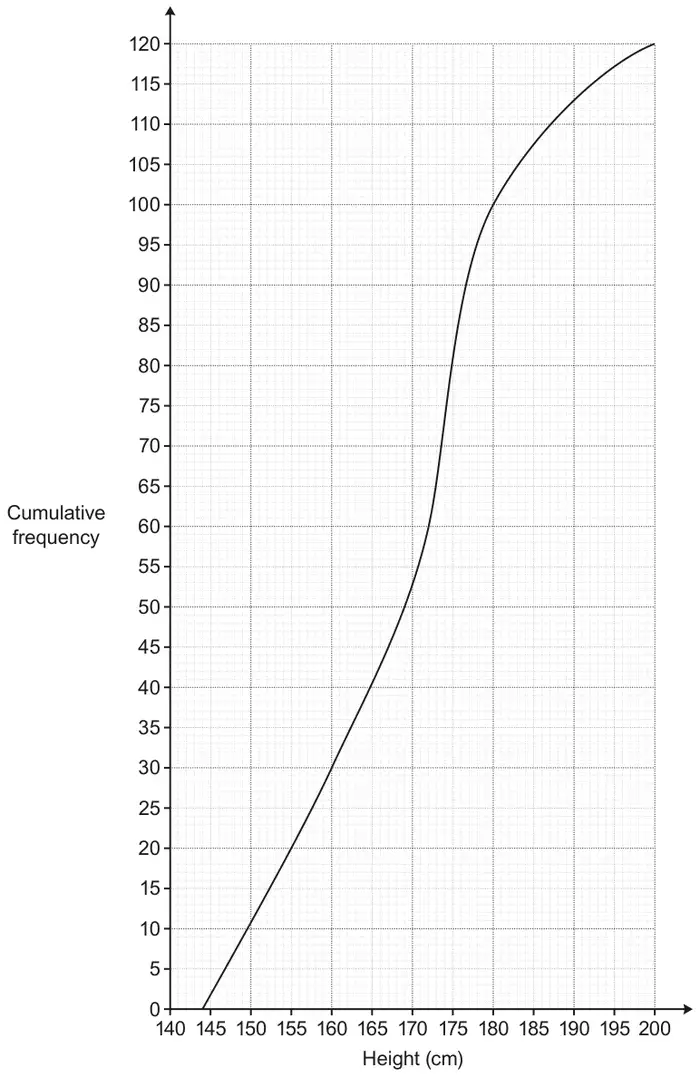
(a) The cumulative frequency graph shows the distribution of the heights of members of a rowing club.
(i) Find the median. [1]
(ii) Find the interquartile range. [2]
(iii) Calculate the percentage of the members who are at least 180 cm tall. [3]
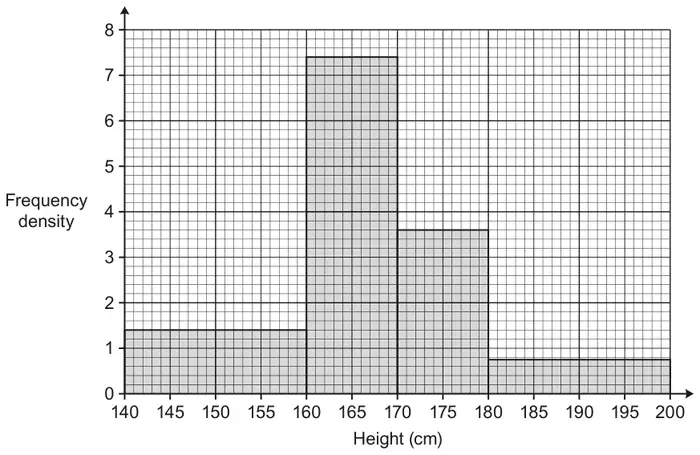
(b) The histogram summarises the heights of the 153 members of a swimming club.
Which club has the greater median height? You must show all your working. [5]
Mark scheme (a)
Answer
Marks
Part marks and guidance
(i) 172
1
(ii) 16 to 17
2
B1 for 160 or 176 to 177 (may be written or indicated on graph, not just a line through it)
(iii) 16.6 to 16.7 or 17
3
B2 for [0].83[3…] or 83[.3…]% or [0].166… or [0].167 or [0].17 OR B1 for 100 (from graph) or 20 M1 for \(\frac{\textit{their }100}{120}\) [× 100] or \(\frac{\textit{their }20}{120}\) [× 100]
Mark scheme (b)
Answer
Marks
Part marks and guidance
76.5 or 77 and 102 or both 28 (or 14+14) and 74
Swimming club has a median in group 160 to 170 oe [Rowing club has median their 172] So rowing club [has higher median] oe FTtheir(a)(i) for conclusion
5
B1 for 76.5 or 77 M2 for 20 × 1.4 and 10 × 7.4 soi by 102 or both 28 (or 14+14) and 74 or M1 for 20 × 1.4 or 10 × 7.4 soi by 28 (or 14+14) or 74 Accept any correct alternative methods (e.g. 5 squares = 1 person) B1 for [swimming club has a median in group] 160 to 170 oe e.g. “\(\leqslant 170\)” (if they use a proportional calculation answer 166 to 167) A1dep on previous 4 marks for “rowing club [has higher median]” oe FTtheir(a)(i) for conclusion