
Higher November 2019 Paper 4 Q12
12 The cumulative frequency graph summarises the annual salary, \(p\) (£ thousands), of the 60 workers in a factory.
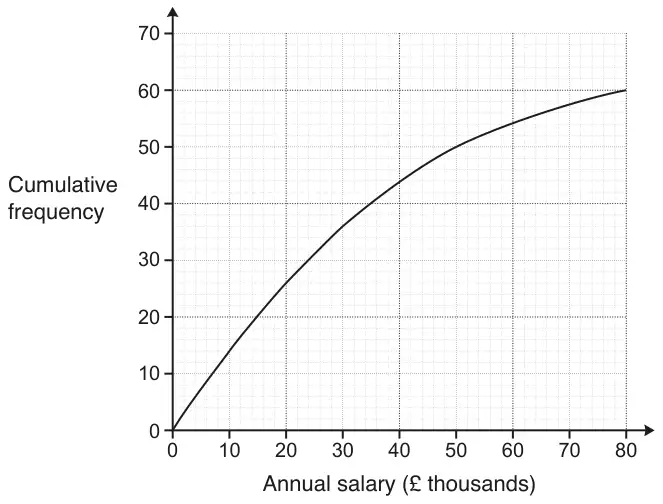
(a) Use the graph to estimate the median annual salary. [1]
(b) Complete this cumulative frequency table.
[2]
| Annual salary, p (£ thousands) | Cumulative frequency |
|---|---|
| \(p \leqslant 10\) | |
| \(p \leqslant 20\) | |
| \(p \leqslant 30\) | |
| \(p \leqslant 50\) | |
| \(p \leqslant 80\) |
(c) Use the information in the cumulative frequency table to calculate an estimate of the mean annual salary. [5]
(d) Explain why your estimate of the median is more reliable than your estimate of the mean. [1]
| Answer | Marks | Part marks and guidance | |
|---|---|---|---|
| 24 | 1 | condone 24 000 | |
| Answer | Marks | Part marks and guidance | |
|---|---|---|---|
| 14 26 36 50 60 | 2 | B1 for complete table with three correct | |
| Answer | Marks | Part marks and guidance | |
|---|---|---|---|
| 28.5 | 5 | B1FT for frequencies 14, 12, 10, 14, 10 with one error (allow FT table in (b)). B1 for 5, 15, 25, 40, 65 (allow one error) M1 for \(\sum(\textit{their midpoint} \times \textit{their frequency})\) M1 for their 1710 ÷ 60 | implied by 70 + 180 + 250 + 560 + 650 or 1710 their midpoint must be within the group range |
| Answer | Marks | Part marks and guidance | |
|---|---|---|---|
| Acceptable answer e.g. for the mean the figures used are approximate | 1 | See exemplars in appendix | |
Appendix: Exemplar responses for Q12(d)
| Response | Mark |
|---|---|
| Because the median estimate is only affected by mistakes in measuring | 1 |
| Because the mean relies on assumption that all values lie at midpoint | 1 |
| Median is accurately read from graph, mean is estimated …. | 1 |
| Number of people earning each amount is not evenly spread out ….. | 1(BOD) |
| Mean has no exact values … | 1 |
| Accurate line graph instead of an assumption …. | 1(BOD) |