
Higher June 2019 Paper 3 Q21
21 The histogram gives information about the distribution of the weights of some onions grown by a farmer.
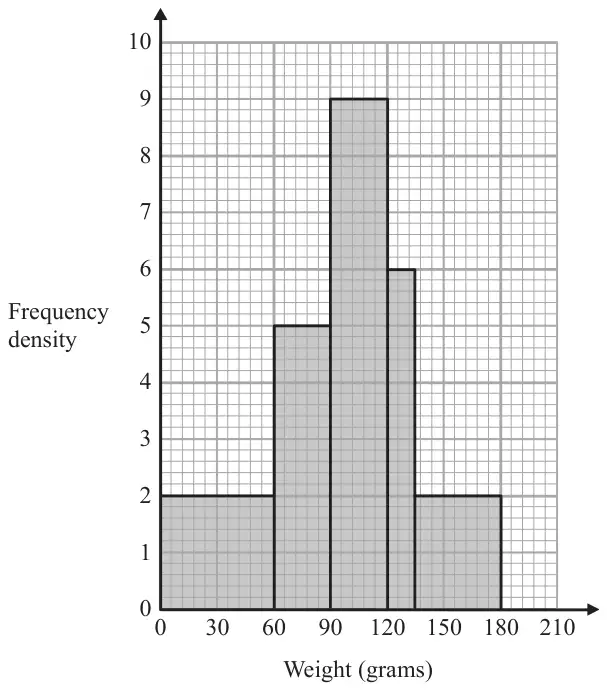
Onions less than 60 grams in weight are used for pickling.
Onions greater than 120 grams in weight are sold at the market.
The rest of the onions are sent to a food processing factory.
A pie chart is drawn using the information above to show what the farmer does with the onions he grows.
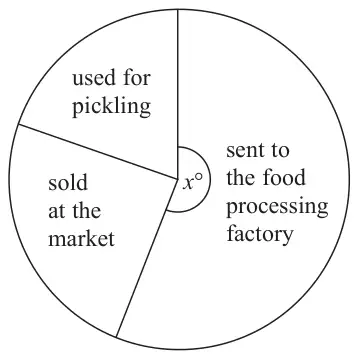
The angle of the sector for the onions sent to the food processing factory is \(x^\circ\).
Work out the value of \(x\). (4)
| Answer | Mark | Mark scheme |
|---|---|---|
| 210 | M1 | for method to find total frequency, \(60 \times 2\ (= 120) + 30 \times 5\ (= 150) + 30 \times 9\ (= 270) + 15 \times 6\ (= 90) + 45 \times 2\ (= 90)\) or 720 OR for method to find the total area, \(4 + 5 + 9 + 3 + 3\) (= 24 cm2) |
| M1 | for finding the number of onions less than 60 g or greater than 120 g = \(120 + 90 + 90\ (= 300)\), OR for finding the number of onions between 60 g and 120 g = \(150 + 270\ (= 420)\) OR for finding the area under the graph less than 60 or greater than 120 = \(4 + 3 + 3\) (= 10 cm2) OR for finding the area under the graph between 60 and 120 = \(5 + 9\) (= 14 cm2) | |
| M1 | (dep M2) for \(1 - \dfrac{\text{``}300\text{''}}{\text{``}720\text{''}}\ \left(= \dfrac{7}{12}\right)\) oe OR for \(\dfrac{\text{``}420\text{''}}{\text{``}720\text{''}}\ \left(= \dfrac{7}{12}\right)\) oe OR for \(\dfrac{\text{``}14\text{''}}{\text{``}24\text{''}}\ \left(= \dfrac{7}{12}\right)\) oe | |
| A1 | cao |
Additional guidance
Accept one error in total for the award of the method marks
24 must be from adding areas of bars not heights of bars
14 must be from adding areas of bars not heights of bars
Accept 58.3...%