
June 2025 Paper 1 Q9
9.
A racing car is driven along a straight road.
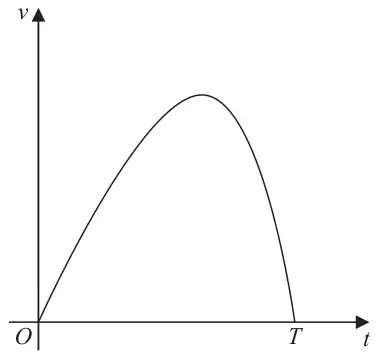
Figure 2 shows a graph of the speed of the car as it travels along the road.
The car starts from rest and is driven for \(T\) seconds before stopping.
The speed of the car is modelled by the equation
\[v = 15t - t\,\mathrm{e}^{0.2t} \qquad\qquad 0 \leqslant t \leqslant T\]where \(t\) seconds is the time after the car starts to move.
According to the model,
Using the iteration formula
\[t_{n+1} = 5\ln\left(\frac{75}{t_n + 5}\right) \qquad\qquad \text{with } t_1 = 8\]| Scheme | Marks | AO |
|---|---|---|
| \(0 = 15T - T\,\mathrm{e}^{0.2T} \Rightarrow \mathrm{e}^{0.2T} = 15\) | M1 | 3.4 |
| \((T =)\) awrt 13.5 | A1 | 1.1b |
| (2) |
Notes
May use \(t\) or another variable which is acceptable.
M1: Uses the model with \(v = 0\) and proceeds to \(\mathrm{e}^{0.2T} = 15\) Do not be concerned by the use of an inequality sign instead of an equals.
May be implied by awrt 13.5
A1: \((T =)\) awrt 13.5 units are not required but if given they must be seconds (or e.g. secs or s)
| Scheme | Marks | AO |
|---|---|---|
| Attempts to differentiate using the product rule \(\left(\dfrac{\mathrm{d}}{\mathrm{d}t}\left(t\,\mathrm{e}^{0.2t}\right) =\right) 0.2t\,\mathrm{e}^{0.2t} + \mathrm{e}^{0.2t}\) | M1 | 1.1b |
| \(v = 15t - t\,\mathrm{e}^{0.2t} \Rightarrow \left(\dfrac{\mathrm{d}v}{\mathrm{d}t} =\right) 15 - \left(0.2t\,\mathrm{e}^{0.2t} + \mathrm{e}^{0.2t}\right)\) | A1 | 1.1b |
| Sets their \(\dfrac{\mathrm{d}v}{\mathrm{d}t} = 0 \Rightarrow \mathrm{e}^{0.2t}(0.2t + 1) = 15 \Rightarrow \mathrm{e}^{0.2t} = \dfrac{15}{0.2t + 1}\) | dM1 | 3.1b |
| \(\Rightarrow t = 5\ln\left(\dfrac{75}{t + 5}\right)\) * | A1* | 2.1 |
| (4) |
Notes
If no attempt is seen for (b) then allow differentiation seen in (a) to score in (b)
M1: Attempts to use the product rule to differentiate \(t\,\mathrm{e}^{0.2t}\) achieving the form \(A\mathrm{e}^{0.2t} + Bt\mathrm{e}^{0.2t}\) (\(A\) and \(B\) both non zero but may be 1) which may be unsimplified. It is likely to be part of an expression.
A1: \(\left(\dfrac{\mathrm{d}v}{\mathrm{d}t} =\right) 15 - \left(0.2t\,\mathrm{e}^{0.2t} + \mathrm{e}^{0.2t}\right)\) o.e. which may be unsimplified. (Condone a missing trailing bracket)
Do not allow recovery of signs to score this mark if they initially write
e.g. \(15 - 0.2t\,\mathrm{e}^{0.2t} + \mathrm{e}^{0.2t} = 0\) and on a later line correct this. e.g. \(15 - 0.2t\,\mathrm{e}^{0.2t} - \mathrm{e}^{0.2t} = 0\)
dM1: Sets \(15 \pm A\mathrm{e}^{0.2t} \pm Bt\mathrm{e}^{0.2t} = 0\) (the =0 may be implied), attempts to make \(\mathrm{e}^{\pm 0.2t}\) (or \(C\mathrm{e}^{\pm 0.2t}\)) the subject and proceeds to the form
\(C\mathrm{e}^{0.2t} = \dfrac{D}{E + Ft}\) or \(C\mathrm{e}^{-0.2t} = \dfrac{E + Ft}{D}\) (where \(C\) can be 1 and \(A, B, C, D, E, F \neq 0\))
It is dependent on the previous method mark.
May see \(15 - \text{``}0.2t\,\mathrm{e}^{0.2t} - \mathrm{e}^{0.2t}\text{''} = 0 \Rightarrow \mathrm{e}^{0.2t} = \dfrac{15}{0.2t + 1}\) which scores dM1
They must take out a factor of \(\mathrm{e}^{\pm 0.2t}\) (or \(C\mathrm{e}^{\pm 0.2t}\)) and divide by their bracket. Condone sign slips in their rearrangement, however, if they take logs of both sides first, the rearrangement must be correct (with no sign slips).
Allow invisible brackets to be implied by further work which is not the given answer.
A1*: Achieves the given answer with no errors seen including use of invisible brackets (but condone a missing trailing bracket) All previous marks in (b) must have been scored. The = 0 must have been seen somewhere in their solution. Do not allow this mark to be scored for proceeding directly from
\(\mathrm{e}^{0.2t}(0.2t + 1) = 15 \Rightarrow t = 5\ln\left(\dfrac{75}{t + 5}\right)\) which is A0*
We must see either \(\mathrm{e}^{0.2t} = \dfrac{15}{0.2t + 1}\) o.e. or an unsimplified expression for \(t\)
e.g. \(t = 5\ln\left(\dfrac{15}{0.2t + 1}\right)\) before achieving the given answer. Condone \(t = 5\ln\dfrac{75}{t + 5}\)
| Scheme | Marks | AO |
|---|---|---|
| (i) Attempts \(t_2 = 5\ln\left(\dfrac{75}{8 + 5}\right)\) | M1 | 1.1b |
| awrt 8.478 | A1 | 1.1b |
| (ii) awrt 8.55 seconds (including units) | A1 | 3.2a |
| (3) | ||
| (9 marks) |
Notes
(c)(i) Check by the question. If there is a contradiction between answers, the answer in the main body of the script takes precedence.
M1: Attempts to use the iteration formula at least once. \(t_2 = 5\ln\left(\dfrac{75}{8 + 5}\right)\). May be implied by awrt 8.76 or awrt 8.48 or awrt 8.58. It is not implied by awrt 8.55
A1: awrt 8.478 (on its own can score M1A1)
(c)(ii) This mark can only be scored provided in (c)(i) M1 has been scored so M0A0A1 is not a possible mark profile.
A1: awrt 8.55 seconds (e.g. s or secs) Requires units.
If the candidate lists their iterations but does not select an answer then take the final value, which still requires units to be stated (which in many cases is likely to be omitted)
Note that awrt 8.55 does not imply M1.