
Numeracy Intermediate June 2025 Unit 2 Q12
12. Gwilym is giving a talk about the amount of food that was wasted in 2019.
In 2019, the world produced 931 million tonnes of food waste.
Of this:
- 569 million tonnes was from households
- 243 million tonnes was from food services
- 119 million tonnes was from retail sectors.
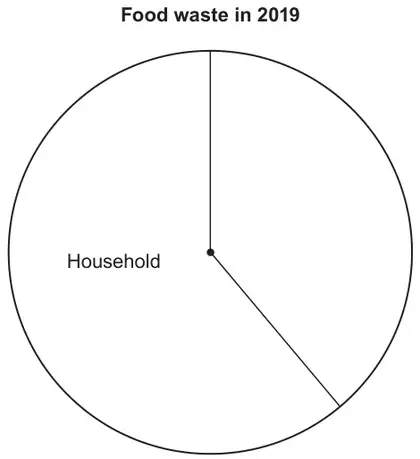
Gwilym wants to draw a pie chart to display this information.
Complete the table below.
Then complete Gwilym’s pie chart.
You must show all your working. [4]
| Food waste | Angle in a pie chart |
|---|---|
| Household | 220° |
| Food service | ……………… ° |
| Retail sector | ……………… ° |
Gwilym has found some further details of food waste in 2019.
| Country | Total food waste in kilograms | Population |
|---|---|---|
| China | 91 646 213 000 | 1 440 000 000 |
| France | 5 522 358 000 | 65 400 000 |
| United Kingdom | 5 199 825 000 | 67 600 000 |
The population data seems to be given correct to a certain number of significant figures.
To how many significant figures does the data seem to be given?
Circle your answer. [1]
Three One Ten Eight Two
Use the data from the table above to complete the following statements.
You must show all your working. [4]
‘On average, a person in France produced …………… kilograms of food waste.
This was …………… times the average amount of food waste per person in China.’
The area of the United Kingdom is 242 500 km\(^2\).
Use this information and the information in the table above to answer the following questions about 2019.
…………… people per km\(^2\)
Give your answer in tonnes. [3]
…………… tonnes
| Scheme | Mark | Comments | ||||||||||||
|---|---|---|---|---|---|---|---|---|---|---|---|---|---|---|
| For an appropriate method to calculate a missing angle: \(\dfrac{243}{931}\) × 360 or \(\dfrac{243}{362}\) × 140 or \(\dfrac{243}{569}\) × 220 \(\dfrac{119}{931}\) × 360 or \(\dfrac{119}{362}\) × 140 or \(\dfrac{119}{569}\) × 220 | M1 | Or equivalent with consistent place value when attempting to write in millions in full In the calculations shown on the left, allow appropriate sight of the following:
| ||||||||||||
| (Food service) 93.9(663...°) or 94(°) AND (Retail sector) 46(.015...°) | A1 | Do not award A mark from incorrect method, M0 A0, (e.g. 140 ÷ 3 = 46.66….°) Allow A1 for
Award M1 A0 A0 for 97.2° and 47.6° (from premature approximation of 1° represents 2.5 million tonnes, 243 ÷ 2.5 and 119 ÷ 2.5) Award M0 A0 A0 for 94.5° and 46.277..° (from \(\dfrac{140}{360}\) × 243 and \(\dfrac{140}{360}\) × 119 ) | ||||||||||||
| Pie chart completed correctly with labels for Food service AND Retail sector | A2 | Tolerance for angles ± 2° For A2 or A1 FT ‘their derived angles’ provided the sum of ‘their derived angles’ = 140° ± 2° (and at least M1 previously awarded) A1 for the pie chart completed correctly without labels An unsupported correct pie chart, with no angles stated in the table, is awarded SC2 with labels, or SC1 without labels, not from sight of incorrect angles in the table |
Corrected by Westie's Workshop
- The board's mark scheme printed “1° represents 2.58(…), 2.59 or 2.6 million people” and “1° represents 2.5 million people”. Changed “people” to “tonnes” in both places because the pie chart shows food waste in millions of tonnes (931 ÷ 360 = 2.586… million tonnes per degree).
Original: see the board's mark scheme PDF (link above).
| Scheme | Mark | Comments |
|---|---|---|
| (i) Three | B1 | |
| (ii) (France per person) answer in the range 84(kg) to 85 (kg) | B2 | B1 for appropriate sight of (France per person) or equivalent, e.g. 5 522 358 000 ÷ 65 400 000 (= 84.4...) 5 520 000 000 ÷ 65 400 000 (= 84.4...) 5 500 000 000 ÷ 65 400 000 (= 84.09...) 5 500 000 000 ÷ 65 000 000 (= 84.6...) 6 000 000 000 ÷ 70 000 000 (= 85.7…) |
| (In the range) 1.27 to 1.4 (times) | B2 | Accept an equivalent fraction in this range FT provided at least B1 previously awarded, for ‘their France per person’ ÷ China per person accurately evaluated, provided 61 ≤ ‘their China per person’ ≤ 66 B1 for appropriate sight of ‘China per person’ evaluated, allow rounded or truncated to an integer value, e.g. 91 646 213 000 ÷ 1 440 000 000 = 63.6.. 91 600 000 000 ÷ 1 440 000 000 = 63.6.. 92 000 000 000 ÷ 1 440 000 000 = 63.8.. 92 000 000 000 ÷ 1 400 000 000 = 65.7.. 92 000 000 000 ÷ 1 500 000 000 = 61.3.. 90 000 000 000 ÷ 1 000 000 000 = 90 The answers in the statement takes precedence In this question, if 1 of the 2 numbers shown in an appropriate division has an initial ‘factor of 10’ place value error, treat this as a misread allowing a possible B1 (rather than B2) in either stage, may be implied by ‘their answer’ |
| Scheme | Mark | Comments |
|---|---|---|
| (i) Answer in the range 278 to 284 (people per km\(^2\)) | B2 | B1 for appropriate sight of any one of the following:
In this question, if one of the two numbers shown has an initial ‘factor of 10’ place value error, treat this as a misread, allowing possible B1 (for appropriate division), may be implied by ‘their answer’ |
| (ii) 5 199 825 000 | Allow suitable approximation, e.g. 5 200 000 000 or 5 000 000 000 Method marks may be awarded in either order | |
| ÷ 1000 | M1 | May be implied in working, e.g. starting 5 199 825 |
| ÷ 242 500 | M1 | Allow suitable approximation, e.g. 200 000 or 240 000 or 242 000 or 243 000 |
| Answer in the range 21 to 22 (tonnes) | A1 | Only accept answers in the range, however allow 20 (tonnes) provided not from incorrect working Answer space takes precedence If no marks, award SC1 for an unsupported answer with digits 214(4…) In this question, excluding 1000, if one of the other 2 numbers shown has an initial ‘factor of 10’ place value error, treat this as a misread |