
Numeracy Higher June 2019 Unit 2 Q7
7. The masses of the players in the men’s 2017-2018 Wales rugby squad are shown in the histogram below.
The squad consisted of 34 players.
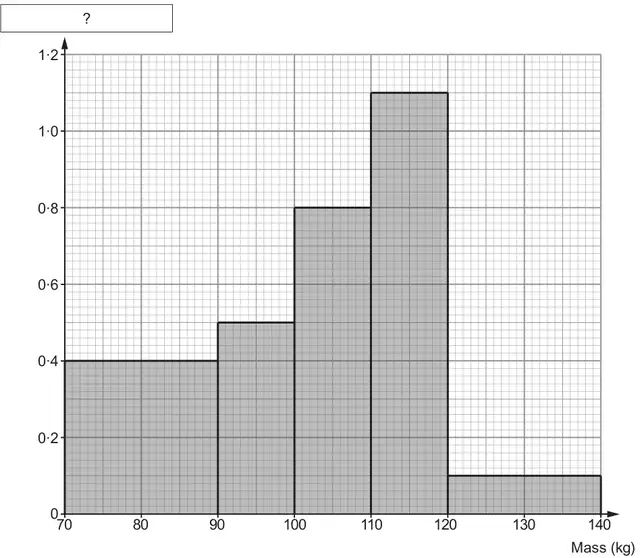
(a) The label is missing on the vertical axis. What should the label be?
Circle your answer. [1]
Circle your answer. [1]
Frequency Number of players Density
Cumulative frequency Frequency density
(b) Ben says,
“The histogram shows that the mass of the heaviest member of the squad was double the mass of the lightest member of the squad.”
Is Ben correct?
Yes ☐ No ☐ You cannot tell ☐
You must give a reason for your choice. [1]
Reason: ……………………………………
(c) The Forwards were the heaviest players in the squad.
The lightest Forward had a mass of 104 kg.
Calculate the maximum possible number of Forwards there could have been in the squad.
You must show all your working. [3]
The lightest Forward had a mass of 104 kg.
Calculate the maximum possible number of Forwards there could have been in the squad.
You must show all your working. [3]
(d) To make a comparison with other teams, the coach wanted to know the mean mass of all the players in the squad.
Use the histogram to calculate an estimate of the mean mass of all the players in the squad. [5]
Use the histogram to calculate an estimate of the mean mass of all the players in the squad. [5]
| Scheme | Marks | Comments |
|---|---|---|
| Frequency density | B1 |
| Scheme | Marks | Comments |
|---|---|---|
| ‘No’ OR ‘You cannot tell’ AND e.g. ‘The heaviest player could have been 140 kg and the lightest player could have been 70 kg, but we cannot tell’, ‘It doesn’t give you the mass of any player’, ‘You cannot tell exact weights because it is grouped data’ OR No AND e.g. ‘The lightest and heaviest players could not be 70kg and 140kg because of how groups are written’ | E1 | Do not accept reasons e.g. ‘Because it is grouped data’ without further explanation about how the data could be distributed in the groups, or ‘The graph is not accurate enough’ |
| Scheme | Marks | Comments |
|---|---|---|
| 10×0.8 + 10×1.1 + 20×0.1 | M1 | Allow for x×0.8 + 10×1.1 + 20×0.1, where 6 ≤ x <10 |
| = 21 | A2 | May be seen on the diagram CAO A1 for 17.8, possibly rounded to 17 or 18 If no marks, SC1 for sight of 10×1.1 + 20×0.1, or 11 + 2, or 13 May be seen on the diagram |
| Scheme | Marks | Comments |
|---|---|---|
| (Mid-points) 80, 95, 105, 115, 130 | B1 | May be seen on the graph |
| (Frequencies of) 8, 5, 8, 11, 2 | B1 | May be seen on the graph or in (c) FT 'their 8, 11, 2' from (c) |
| 80×8 + 95×5 + 105×8 + 115×11 + 130×2 or equivalent (640 + 475 + 840 + 1265 + 260 = 3480) | M1 | FT their frequencies (but not use of frequency densities 0.4, 0.5, 0.8, 1.1 and 0.1) AND FT their mid-points provided they are within the groups (inclusive of the boundaries) |
| ÷ 34 | m1 | Allow FT for the sum of their frequencies |
| = 102.3(529…) or 102.4 | A1 | CAO Allow an answer of 102 from correct working |