(a)Kenworth Electrical specialises in wiring new houses. The monthly wages of all Kenworth Electrical employees are summarised in the frequency table below.
Monthly wage, £\(x\)
Frequency
\(1800 \leqslant x \lt 2000\)
64
\(2000 \leqslant x \lt 2100\)
50
\(2100 \leqslant x \lt 2400\)
2
\(2400 \leqslant x \lt 5800\)
0
\(5800 \leqslant x \lt 7800\)
4
(i) In which group does the median monthly wage lie? Circle your answer. [1]
\(1800 \leqslant x \lt 2000\) \(2000 \leqslant x \lt 2100\) \(2100 \leqslant x \lt 2400\) \(2400 \leqslant x \lt 5800\) \(5800 \leqslant x \lt 7800\)
(ii) Alysia is an accountant working for Kenworth Electrical. She knows the exact wage of each employee.
Alysia says,
It would be misleading to use the mean monthly wage as an average.
Explain why Alysia has reached this conclusion. [1]
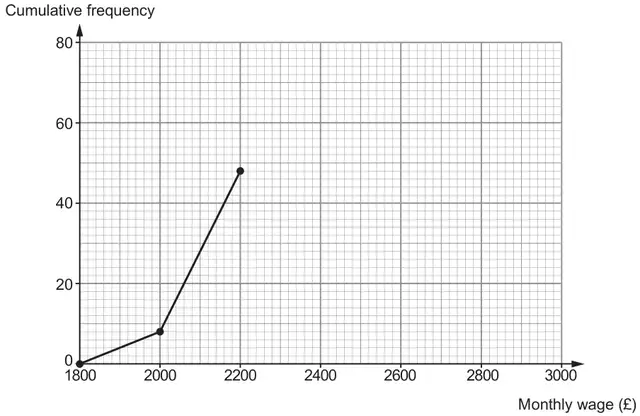
(b)Maesteg Electrical also specialises in wiring new houses. The monthly wages of all Maesteg Electrical employees are summarised in the frequency table below.
Monthly wage, £\(x\)
Frequency
\(1800 \leqslant x \lt 2000\)
8
\(2000 \leqslant x \lt 2200\)
40
\(2200 \leqslant x \lt 2400\)
24
\(2400 \leqslant x \lt 3000\)
8
(i) Use the frequency table to complete the following cumulative frequency diagram to display the monthly wages of all Maesteg Electrical employees. [2]
Use the cumulative frequency diagram to answer each of the following questions.
(ii) Which of the following is the best estimate for the median monthly wage of Maesteg Electrical employees? Circle your answer. [1]
£2100 £2160 £2200 £2360 £3000
(iii) Calculate an estimate of the percentage of Maesteg Electrical employees who have a monthly wage of less than £2050. You must show all your working. [2]
Mark scheme (a)
Scheme
Marks
Comments
(i) \(1800 \leqslant x \lt 2000\)
B1
Accept ‘(£)1800 to (£)2000’, or ‘(£)1800 – (£)2000’
(ii) Reason based on agreement due to the 4 people earning £5800 to £7800 per month or the majority of lower wages, e.g. ‘the data is skewed’, ‘only a few of the employees will earn more than the mean wage’, ‘because most people employed are in the lowest 2 groups of the monthly wage’ ‘as the majority earn between 1800 and 2100’
E1
Allow, e.g. ‘because there is a great difference between the monthly wages’, ‘the big numbers would affect the mean’, ‘more than half are in the first group’
Do not accept, e.g. 'she doesn't know the exact values', ‘using the median would be better', ‘because there are no employees that have between 2400 and 5800 monthly wage’, ‘there are 64 in the first group’
Mark scheme (b)
Scheme
Marks
Comments
(i) (2200, 48) joined to (2400, 72) joined to (3000, 80)
B2
Joined with a curve or a straight line B1 for a cumulative graph with either of the following:
correct plots but not joined,
‘their 2 plots’ joined provided 1 plot ‘correct’ including FT plot at (3000, 48 < y ≤ 80)
(ii) £2160
B1
(iii) 22.5(%) OR answer from correct working in the range 21(.25%) to 23.75(%) or 24(%)
B2
Working \(\dfrac{\text{17}}{\text{80}}\) × 100 to \(\dfrac{\text{19}}{\text{80}}\) × 100
B1 for sight of \(\dfrac{\text{17}}{\text{80}}\) to \(\dfrac{\text{19}}{\text{80}}\)
We'd like to use Google Analytics cookies to count visits and see which pages help most. They're optional, and the site works exactly the same either way. Privacy policy