
Numeracy Foundation November 2019 Unit 2 Q10
10. Some students were asked to select an even number between 0 and 100.
The heights of these students and the number they each selected are shown in the scatter diagram below.
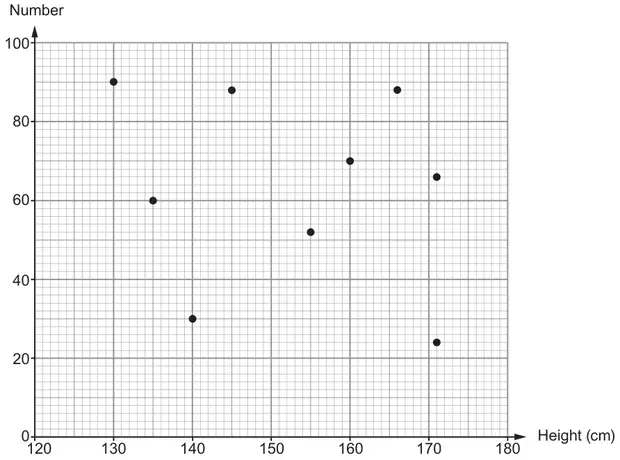
(a) Describe the correlation shown by the scatter diagram. [1]
(b) Gwenda and Daniel selected the same number.
Gwenda is shorter than Daniel.
Lotte is the shortest student.
Iona and Steffan are both the same height.
Iona selected a number greater than 40.
Gwenda is shorter than Daniel.
Lotte is the shortest student.
Iona and Steffan are both the same height.
Iona selected a number greater than 40.
Complete the table. [4]
| Name | Height (cm) | Number |
|---|---|---|
| Gwenda | ||
| Daniel | ||
| Lotte | ||
| Iona | ||
| Steffan |
| Scheme | Marks | Comments |
|---|---|---|
| Descriptions of no correlation, e.g. ‘no relationship’, ‘no correlation’, 'none', ‘no connection’ | B1 | Allow, e.g. ‘no’ Do not accept, e.g. '(all) scattered (about)' 'random', ‘neutral’, ‘no pattern’, ‘varied correlation’, ‘mixed correlation’ Allow if a correct response is given with one of the phrases listed above. Do not allow a correct response with an incorrect response, e.g. ‘none but slightly positive’ |
| Scheme | Marks | Comments | ||||||||||||||||||
|---|---|---|---|---|---|---|---|---|---|---|---|---|---|---|---|---|---|---|---|---|
| B4 | All entries correct B3 for any 8 or 9 entries correct B2 for any 5, 6 or 7 entries correct B1 for any 3 or 4 entries correct Penalise -1 only if entries are consistently reversed in the table |