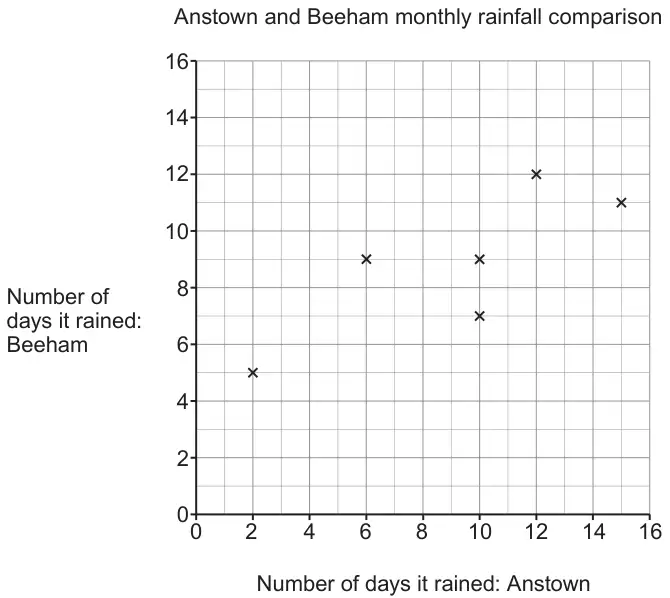
11. Anisha wants to compare the number of days it rained each month, in Anstown and Beeham, in 2018.
(a)
Anisha has plotted the data for the first 6 months on the scatter graph below.
The data for the last 6 months is given in the table.
Number of days it rained: Anstown
4
9
8
13
14
15
Number of days it rained: Beeham
7
9
6
10
12
13
Plot the data for the last 6 months on the scatter graph above. [2]
(b) What does your scatter graph show about the relationship between the number of days it rained in Anstown and the number of days it rained in Beeham? [1]
(c) Use the scatter graph to find how many months it rained on 11 days or more in both Anstown and Beeham? [1]
Mark scheme (a)
Scheme
Marks
Comments
6 points plotted correctly
B2
and no extra plots
B1 for any 4 or 5 points plotted correctly and not more than 6 points plotted in total or for 6 points plotted correctly with at most 2 extra incorrect plots
Mark scheme (b)
Scheme
Marks
Comments
Valid comment e.g. ‘It has a positive correlation’ or ‘As number of wet days in Anstown goes up, so does the number of wet days in Beeham.’
B1
Do not allow e.g. ‘It rains more in Anstown than it does in Beeham.’ or ‘It is positive.’
We'd like to use Google Analytics cookies to count visits and see which pages help most. They're optional, and the site works exactly the same either way. Privacy policy