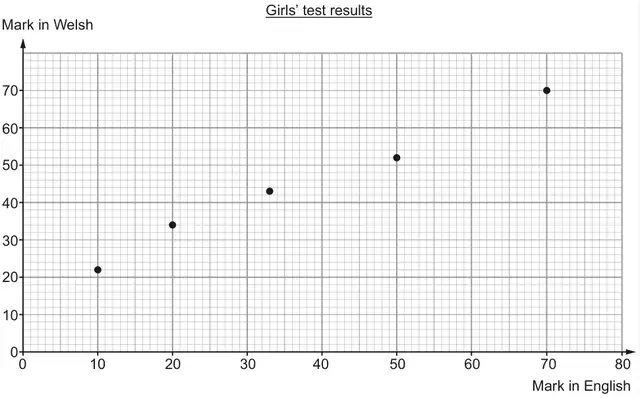
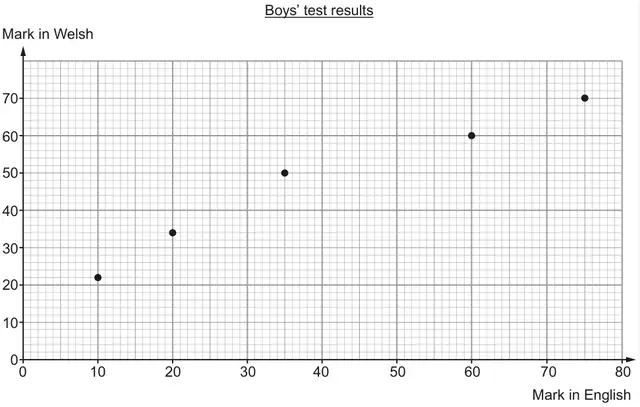
(a) Students are taking tests in English and Welsh. The English test is marked out of 80. The Welsh test is marked out of 70.
(i) Dyfed scores 35 in his English test. Estimate Dyfed’s score as a percentage. Circle your answer. [1]
4% 20% 23% 44% 51%
(ii) Liam scores 22 in his Welsh test. Estimate Liam’s score as a percentage. Circle your answer. [1]
0·3% 3% 22% 31% 40%
(b) Rowena states a hypothesis, ‘Boys do better than girls in their English tests.’
She displays the test marks for 5 girls and 5 boys in scatter diagrams.
(i) Does the data support Rowena’s hypothesis? You must give a reason for your answer. [1]
(ii) How could Rowena improve the testing of her hypothesis? [1]
(c) Draw, by eye, a line of best fit to estimate how many marks you might expect a boy to score in a Welsh test if he scored 50 marks in his English test. [2]
…………… marks
Mark scheme (a)
Scheme
Marks
Comments
(i) 44%
B1
(ii) 31%
B1
Mark scheme (b)
Scheme
Marks
Comments
(i) Conclusion (stated or implied) and reason, e.g. ‘Yes, (as marks of 2 girls and boys are the same, but) marks for 3 boys are better than the marks of the other 3 girls’, 'No, as there is insufficient data'
E1
The conclusion (e.g. yes/no/can’t) MUST match the reason given
Accept ‘no, as she has plotted one score incorrectly’ or similar, i.e. accept ‘no’ if followed by a reasonable explanation Accept ‘yes as some boys had higher marks in English’, ‘Girls marks 10, 20, 33, 50, 70 and boys marks 10, 20, 35, 60, 75 so yes boys do better’, ‘yes as boys scored (17) more overall than girls’, ‘yes as the first 2 are the same, but the last ones are higher’, ‘yes, some boys did better than girls’, ‘yes, because there are more higher plots towards the end of the graph’
Do not accept ‘no because 3 out of 5 boys scored a better mark than the girls’, ‘yes, the boys had higher plots’, ‘the boys had the highest mark’, ‘no, as boys marks are close to the girls marks’, ‘yes, boys had higher marks’, ‘yes because boys do better in English’, ‘yes because the highest mark for girls is 70 and boys is 75’, ‘yes because boys had over 70 marks and girls highest mark was 70’, ‘no, both diagrams are similar’, ‘no, both have positive correlation’, ‘yes, boys have a greater range’
(ii) States or implies 'get more results', 'collect more data', ‘repeat the test’
E1
Do not accept ‘put the results on one graph’, ‘compare the mean scores’
Mark scheme (c)
Scheme
Marks
Comments
Straight line of best fit for boys, appropriate for trends, with points above and below the lines
B1
Do not accept a line of best fit through (0, 0)
Approximately 55 marks
B1
Accept an answer in the range 53 to 57 marks inclusive FT for ‘their line of best fit’ including a ‘curve’ (not dot to dot)
We'd like to use Google Analytics cookies to count visits and see which pages help most. They're optional, and the site works exactly the same either way. Privacy policy