
Numeracy Intermediate June 2018 Unit 1 Q13
13. This year, 50 runners took part in a 5 km race in the Brecon Beacons.
All 50 runners finished the race.
The cumulative frequency diagram below shows the times taken by the runners to finish the race.
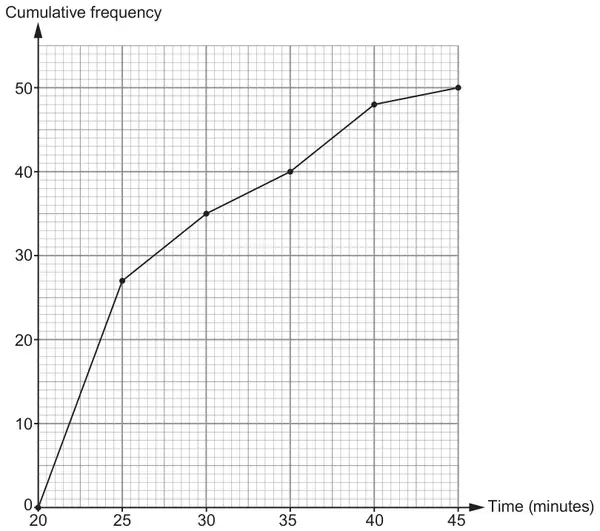
(a) Which is the modal group?
Circle your answer. [1]
Circle your answer. [1]
20 to 25 minutes 25 to 30 minutes 30 to 35 minutes
35 to 40 minutes 40 to 45 minutes
(b) Is it certain that the last runner’s finish time was 45 minutes?
You must give a reason for your answer. [1]
You must give a reason for your answer. [1]
Yes ☐ No ☐
(c) The organisers hoped that 80% of the runners would finish the race within 30 minutes.
Complete the following two statements. [2]
‘…………… % of runners finished the race within 30 minutes.’
‘80% of runners finished the race within …………… minutes.’
(d) Last year, the median finish time was 26 minutes.
By how many minutes was the median time better this year?
You must show all your working. [2]
By how many minutes was the median time better this year?
You must show all your working. [2]
| Scheme | Marks | Comments |
|---|---|---|
| 20 to 25 minutes | B1 |
| Scheme | Marks | Comments |
|---|---|---|
| ‘No’ indicated or unambiguously implied, with a reason, e.g. ‘only shows data for groups’, ‘it was in the group 40 to 45 minutes’, ‘doesn’t show how many runners finished in 45 minutes’, ‘the last 2 runners took between 40 and 45 minutes’ | E1 | Do not accept any reason implying ‘Yes’ Allow ‘No’ with, e.g. ‘the graph shows the cumulative frequency not the actual times’, ‘doesn’t show the actual times’ Do not accept, e.g. ‘it goes to the nearest 5 minutes’, ‘it shows frequency not times of results’, ‘it doesn’t show how many runners finished between 40 and 45 minutes’. ‘because it can be an average’ |
| Scheme | Marks | Comments |
|---|---|---|
| 70% (within 30 minutes)’ | B1 | |
| (80% within) 35 (minutes)’ | B1 |
| Scheme | Marks | Comments |
|---|---|---|
| Difference 26 - 24.5 to 24.8 | M1 | |
Answer in the range
| A1 | Do not accept an answer in the correct range from incorrect working Mark final answer If units are given they must be correct |