
Numeracy Higher November 2018 Unit 1 Q9
9. A group of pupils sat a mathematics test.
The teacher grouped their marks using the intervals 1 to 20, 21 to 40, and so on.
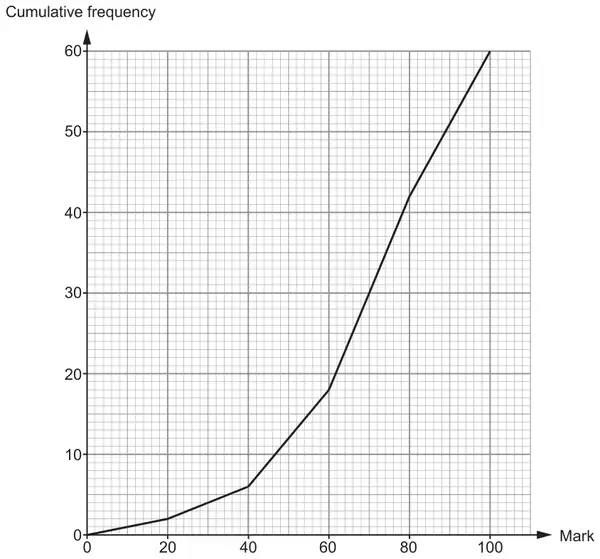
She then drew the following cumulative frequency diagram to display the results.
(a)
Phoebe is one of the pupils who sat the test.
Phoebe says,
‘The cumulative frequency diagram shows that the median mark was 70.’
Explain why the median mark may not be 70. [1]
(b)
Consider the pupils who had a mark of 80 or less.
How many of these pupils would have needed to score more than 80 for Phoebe’s estimate of the median to be 80?
Circle your answer. [1]
10 12 18 5 20
| Scheme | Marks | Comments |
|---|---|---|
| Explanation e.g. ‘Because cumulative frequency is not accurate. It’s an estimate’, or ‘Because the data is grouped. The median could be anywhere between 60 and 80’, or ‘The marks between 60 and 80 may not be evenly distributed’, or ‘The 24 marks between 60 and 80 may not be split evenly either side of 70’, or ‘The 13th mark between 60 and 80 may not be 70’ ‘The 30.5th mark is greater than 70’ | E1 | Do not accept e.g. ‘This is only an estimate’, or ‘Because the data is grouped’ |
| Scheme | Marks | Comments |
|---|---|---|
| 12 | B1 |