5. Madeleine is researching the effects of waves. She does this at two different beaches, Llanddawel and Abertig. She measures the masses of pebbles in a sample taken from each beach.
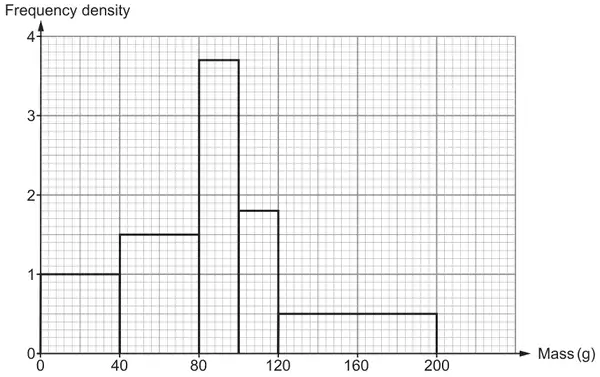
(a) Look at the histogram below. It shows the masses of the pebbles in the sample taken from Llanddawel beach.
Calculate an estimate for the percentage of pebbles in Madeleine’s sample that had a mass of less than 70 g. [5]
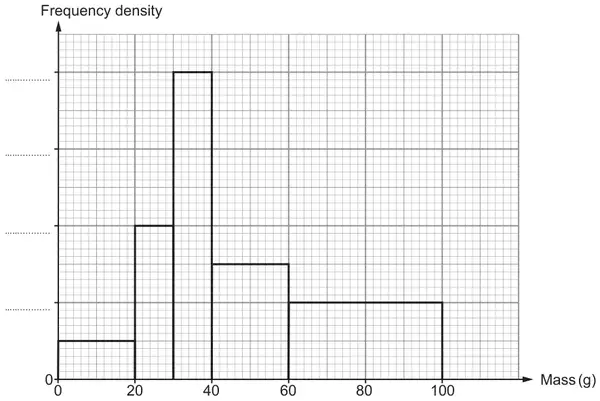
(b) Look at the histogram below. It shows the masses of the pebbles in the sample taken from Abertig beach.
The scale on the vertical axis is missing.
(i) 120 pebbles each had a mass of less than 30 g. Use this fact to complete the frequency density axis above. [2]
(ii) What was the median mass of the pebbles in the sample taken from Abertig beach? Circle your answer. [1]
Allow M1 for the sum of 5 products with any 3 correct
= 250 (pebbles)
A1
CAO
(Number of pebbles < 70g = 40×1 + ¾ of 40×1.5 =) 85
B1
FT ‘their 40×1’ and ¾ of ‘their 40×1.5’
(Percentage < 70g =) \(\dfrac{85}{250}\) (×100)
M1
FT ‘their 85’ provided > 40 and < 100 but not 70 (if not derived) AND FT ‘their derived 250’
= 34 (%)
A1
On FT, the whole number part of their answer needs to be calculated correctly
Mark scheme (b)
Scheme
Marks
Comments
(i) Uniform scale in blocks of 4
B2
Complete numbering of the scale needed up to 16 B1 for
Incomplete scale with at least 1 correct value and no incorrect values
3 correct values and 1 incorrect
Frequency of 40 (for the 1st bar) and 80 (for the 2nd bar). May be seen on diagram. May be seen as frequency of 20 for each 5×5 block
20 × x + 10 × 4x = 120 or equivalent (x being the height of the 1st bar) Accept use of trials for x, with minimum of 2 trials getting closer to 120 OR Evidence that x = 2
20 × y/2 + 10 × 2y = 120 or equivalent (y being the first value on the y-axis) Accept use of trials for y, with minimum of 2 trials getting closer to 120 OR Evidence that y = 4
We'd like to use Google Analytics cookies to count visits and see which pages help most. They're optional, and the site works exactly the same either way. Privacy policy