16. Brian and Yvonne are gardeners. They each have an orchard of fully-grown apple trees.
(a) The table shows information about the height, in cm, of Yvonne’s 43 apple trees on 1st September.
Tree height, \(h\) (cm)
\(200 \lt h \leqslant 250\)
\(250 \lt h \leqslant 260\)
\(260 \lt h \leqslant 290\)
\(290 \lt h \leqslant 300\)
\(300 \lt h \leqslant 320\)
Frequency
5
8
12
13
5
Frequency density
(i) Complete the frequency density row in the table above. [2]
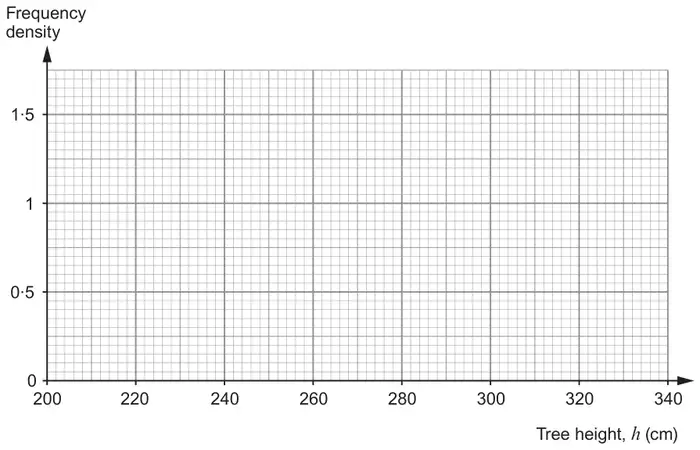
(ii) Draw a histogram to illustrate the data in the table. [2]
(iii) Calculate an estimate of the probability that an apple tree has a height of less than 270 cm. [2]
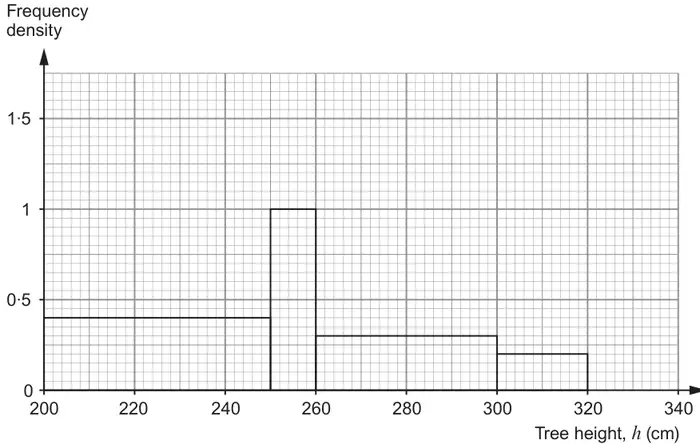
(b) This histogram shows the heights of the apple trees in Brian’s orchard on 1st September.How many apple trees are in Brian’s orchard? [2]
(c) One of the gardeners says,
“I prefer to grow shorter apple trees as the fruit is easier to pick.”
Which person is this likely to be? You must justify your answer. [1]
Mark scheme (a)
Scheme
Marks
Comments
(a)(i) 0.1, 0.8, 0.4, 1.3, 0.25
B2
Allow fractions e.g. \(\dfrac{5}{50}, \dfrac{8}{10}, \dfrac{12}{30}, \dfrac{13}{10}, \dfrac{5}{20}\) B1 for 3 or 4 correct
Table takes precedence
(a)(ii) Fully correct histogram
B2
FT candidate’s frequency density if table has arithmetic errors but the idea of frequency density is used e.g. \(\dfrac{5}{50}, \dfrac{8}{10}, \dfrac{12}{30}, \dfrac{13}{10}, \dfrac{5}{20}\) si
B1 for 3 or 4 correct bars; no gaps
(a)(iii) \(\dfrac{17}{43}\)
B2
B1 for \(\dfrac{5+8+(12\div3)}{43}\) oe OR B1 for 5 + 8 + 4 or 17 seen
Mark scheme (b)
Scheme
Marks
Comments
0.4 × 50 + (1 ×) 10 + 0.3 × 40 + 0.2 × 20
M1
20 + 10 + 12 + 4 si; allow one error
46
A1
Mark scheme (c)
Scheme
Marks
Comments
Brian indicated with a supporting comparison. e.g. ‘Brian has 30 trees less than 260 cm Yvonne has 13.’ or ‘Yvonne has 5 of the smallest trees and Brian has 20’
E1
FT ‘their (b)’; dep on at least M1 in part (b)
Allow e.g. ‘Brian because he has more trees that are below 260 cm’ or ‘Brian as he has a greater probability of having trees less than 270’ or ‘Brian as Yvonne has fewer trees less than 260’ or ‘Brian has (their) 20 and Yvonne has 5 in the smallest group’
Do not allow e.g. ‘Brian because most of his trees are shorter than most of Yvonne’s’ or ‘Brian as he has a larger amount of shorter trees’
We'd like to use Google Analytics cookies to count visits and see which pages help most. They're optional, and the site works exactly the same either way. Privacy policy