
Numeracy Foundation November 2017 Unit 1 Q5
5. The atmosphere above the Earth’s surface is divided into different layers.
The graph shows the average temperature at different heights above sea level.
It also shows the positions of the different layers of the atmosphere.
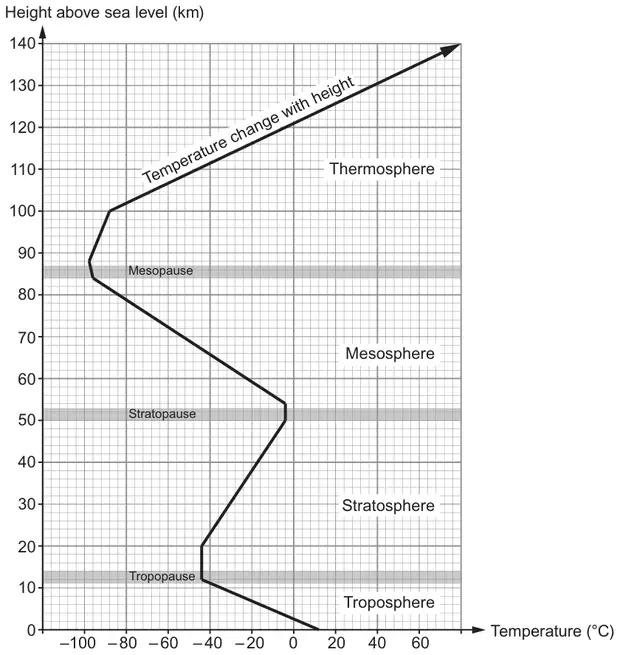
Use the graph to answer the following questions.
(a) What is the approximate temperature 40 kilometres above sea level?
Circle your answer. [1]
Circle your answer. [1]
–30˚C 10˚C –22˚C –18˚C 130˚C
(b) What is the lowest temperature shown in the mesosphere?
Circle your answer. [1]
Circle your answer. [1]
105˚C –105˚C –80˚C 95 ˚C –95 ˚C
(c) What is the approximate difference between the least and the greatest temperature shown in the troposphere? [2]
| Scheme | Marks | Comments |
|---|---|---|
| -18˚C | B1 |
| Scheme | Marks | Comments |
|---|---|---|
| -95˚C | B1 |
| Scheme | Marks | Comments |
|---|---|---|
| Answer in the range 50 to 57 (˚C) | B2 | Allow an answer in the range -50 to -57 Award B1 for a correct calculation that would lead to an answer in the range 50 to 57 or -50 to -57 with values used in the range (10 to 12) and (-40 to -45) Eg Award B1 for 10 – (-40) OR -40 – 10 OR 12 - - 44 OR 11 + 43 If no marks award B1 for the numbers (10 to 12) and (-40 to -45) used in an addition or subtraction calculation e.g. 12 – 44 = ……. |