
Numeracy Foundation June 2022 Unit 1 Q7
7. Rodney records how much energy, in calories, different energy bars provide.
Each energy bar has a mass of 35 g.
Rodney draws a frequency diagram to display his findings.
He uses groups of width 10 calories:
\(100 \leqslant \text{energy} < 110\), \(110 \leqslant \text{energy} < 120\), ......, \(140 \leqslant \text{energy} < 150\)
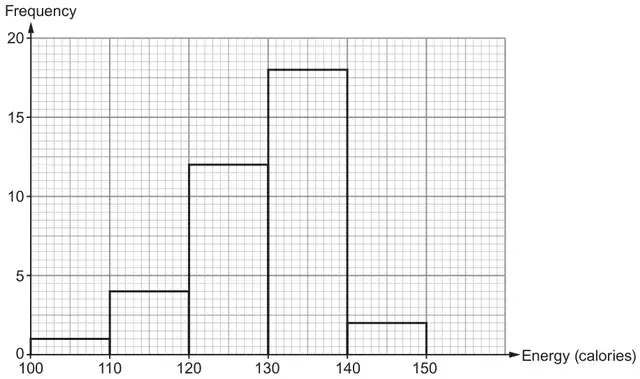
(a) Which is the modal group? [1]
(b) What fraction of the energy bars provide less than 130 calories? [3]
(c) Consider only the energy bars providing 130 calories or more.
What percentage of these energy bars provide 140 calories or more? [2]
What percentage of these energy bars provide 140 calories or more? [2]
| Scheme | Marks | Comments |
|---|---|---|
| 130 ≤ energy < 140 | B1 | Accept unambiguous indication, e.g. 130 – 140 Allow e.g.‘130,140’, ‘130 140’ Do not accept the values 130, 140, 18 or a choice between the group and the frequency |
| Scheme | Marks | Comments |
|---|---|---|
| Total of 37 (energy bars) | B1 | |
| \(\dfrac{1 + 4 + 12}{37}\) | M1 | FT ‘their 37’ provided > ‘their 1+4+12’ Also allow one error in misreading 1 frequency, which impacts consistently on ‘their denominator’ and possibly ‘their numerator’ |
| \(\dfrac{17}{37}\) | A1 | Only FT ‘their 37’ provided
|
| Scheme | Marks | Comments |
|---|---|---|
| (100 ×) \(\dfrac{2}{18 + 2}\) or (100 ×) 1 – (100 ×) \(\dfrac{18}{18 + 2}\) | M1 | FT any repeated misread of the scale from (b) |
| 10 (%) | A1 | Award 2 marks for an answer of 10(%) unless from incorrect working |