
Higher November 2024 Unit 1 Q1
1. The table below shows some of the values of \(y = 2x^2 + x + 3\) for values of \(x\) from –2 to 3.
| \(x\) | –2 | –1 | 0 | 1 | 2 | 3 |
|---|---|---|---|---|---|---|
| \(y = 2x^2 + x + 3\) | 4 | 3 | 6 | 24 |
(a) Complete the table by finding the values of \(y\) for \(x\) = –2 and for \(x\) = 2. [2]
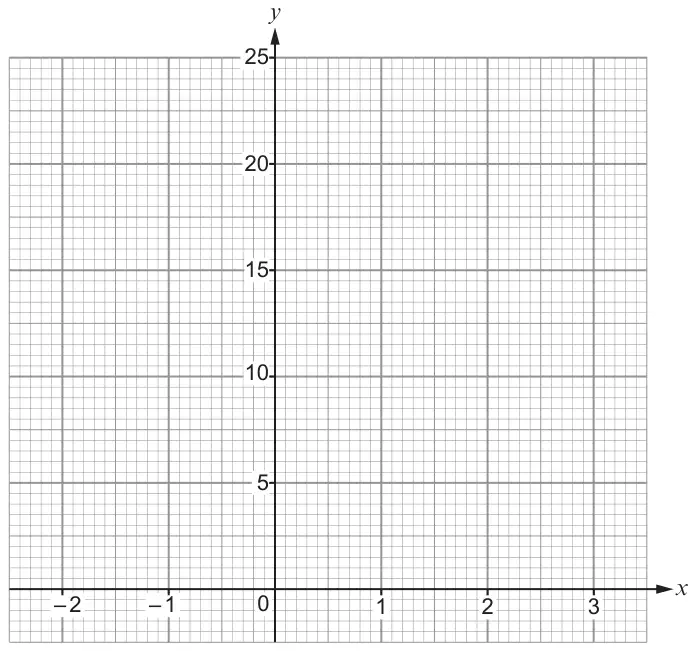
(b) On the graph paper below, draw the graph of \(y = 2x^2 + x + 3\) for values of \(x\) from –2 to 3. [2]
| Scheme | Marks | Comments |
|---|---|---|
| 9 13 | B2 | Answers in table take precedence. B1 for each |
| Scheme | Marks | Comments |
|---|---|---|
| At least 4 correct plots and no incorrect plot. | P1 | FT ‘their (–2,9)’ and ‘their (2,13)’ OR (–2,9) and (2,13) plotted (even when not shown in the table or contradicted). Allow ± ‘½ a small square’. |
| A smooth curve drawn through their plots. | C1 | FT ‘their 6 plots’ OR a curve through the 4 given points AND (–2,9) and (2,13). Clear intention to draw a curve through ‘their plotted points’ (± 1 small square horizontally or vertically). 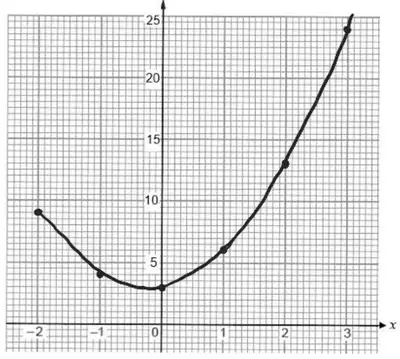 |