
Higher June 2024 Paper 2 Q26
26. One of the attractions at a theme park is a roller coaster.
The graph shows the velocity of the roller coaster, in metres per second, for the first 14 seconds.
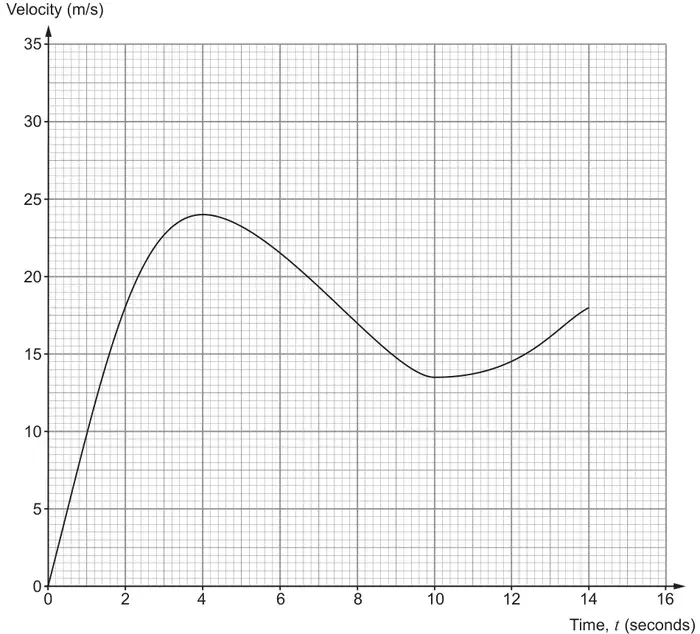
(a) Calculate, in kilometres per hour, the velocity of the roller coaster at time \(t = 4\) seconds. [2]
(b) Calculate an estimate for the acceleration of the roller coaster at time \(t = 2\) seconds.
Give your answer in m/s2. [3]
Give your answer in m/s2. [3]
(c) Describe the acceleration of the roller coaster between \(t = 4\) and \(t = 10\) seconds. [1]
(d) Use five vertical strips of equal width to calculate an estimate for the distance the roller coaster travelled between \(t = 4\) and \(t = 14\) seconds.
Give your answer in metres. [3]
Give your answer in metres. [3]
| Scheme | Marks | Comments |
|---|---|---|
| 86.4 | B2 | B1 for \(24\times3600\div1000\) oe If no marks, award SC1 for an answer of 82.8 (from use of 23) |
| Scheme | Marks | Comments |
|---|---|---|
| Tangent drawn at time 2 seconds. | M1 | M0 if no tangent seen |
| \(\dfrac{\text{Difference in } y}{\text{Difference in } x}\) oe | m1 | Must use correct values for their tangent |
| Correctly evaluated gradient from their tangent | A1 | Accept answer written as an improper fraction (unless it gives a whole number), mixed number or decimal. If answer given as a decimal, it must be correct to 1 decimal place |
| Scheme | Marks | Comments |
|---|---|---|
| A correct explanation e.g. ‘It is decelerating’ ‘The acceleration is negative.’ | E1 | Allow e.g. ‘The roller coaster decelerates.’ Ignore extra spurious comments. ‘The acceleration decreases from t = 4 and then starts to increase again to t = 10.’ Do not allow ‘The acceleration is decreasing.’ ‘The velocity is decreasing.’ |
| Scheme | Marks | Comments |
|---|---|---|
| \(\frac{(24 + 21.5)}{2}\times2 + \frac{(21.5 + 17)}{2}\times2 + \frac{(17 + 13.5)}{2}\times2\) \(+\ \frac{(13.5 + 14.5)}{2}\times2 + \frac{(14.5 + 18)}{2}\times2\) ( = 45.5 + 38.5 + 30.5 + 28 + 32.5) | M2 | M1 for the sum of any 3 correct trapezia. Accept equivalent as triangles and rectangles |
| = 175 (m) | A1 | FT from M1 If no marks award SC2 for an answer in the range 232 to 235.2 (m) or SC1 for working with widths 2.8 and heights of 0, 22, 22.5 to 23, 16, 13.5 to 14, 18 allowing one error with the heights (Misread and distance from t = 0 to t = 14) |
Alternative method
| Scheme | Marks | Comments |
|---|---|---|
| \(\frac{1}{2}\times2\,(24 + 18 + 2(21.5 + 17 + 13.5 + 14.5))\) | M2 | Award M1 if only one value is incorrect. |
| = 175 (m) | A1 | FT from M1 |
| (9) |