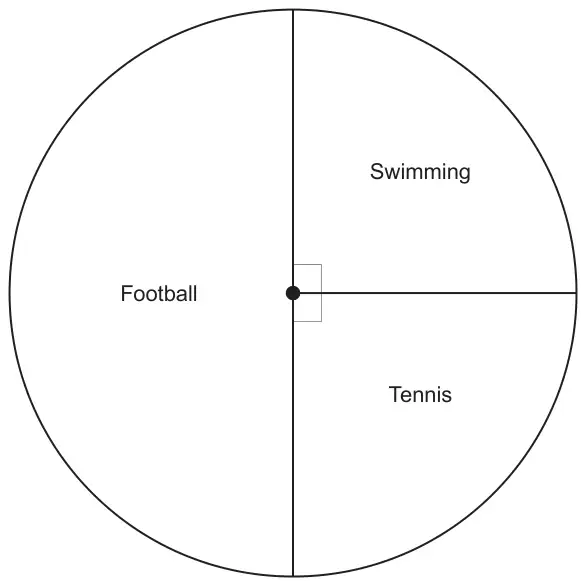
6. The pie chart below shows the favourite sport of 60 people.
(a) Which is the modal sport? [1]
(b) One person is chosen at random. What is the probability that this person said swimming is their favourite sport? [1]
(c) How many people said tennis is their favourite sport? [2]
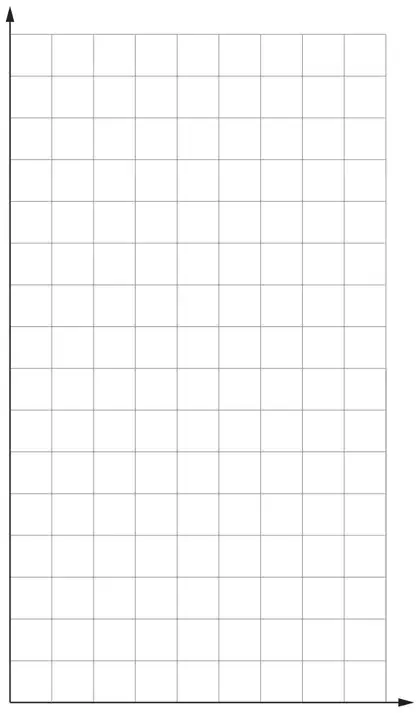
(d) Draw a bar chart to display the favourite sports of the 60 people. Use the grid below. [3]
Mark scheme (a)
Scheme
Marks
Comments
Ribbon mark 6(a),(b),(c),(d) Football
B1
Mark scheme (b)
Scheme
Marks
Comments
Ribbon mark 6(a),(b),(c),(d) 1/4 or equivalent ISW
B1
Do not accept incorrect notation; e.g. 1 in 4,1 out of 4, 1:4.
Mark scheme (c)
Scheme
Marks
Comments
Ribbon mark 6(a),(b),(c),(d) 1/4 × 60
M1
15
A1
Accept 15 out of 60. Award SC1 only, for a final answer of 15/60
Mark scheme (d)
Scheme
Marks
Comments
Ribbon mark 6(a),(b),(c),(d) Correctly labelled axes.
B1
Vertical axis labelled 'number (of people)' or ‘people’ or ‘frequency’ AND horizontal axis marked with the sports.
Uniform scale starting from zero.
B1
Correct equal width bars for football, swimming and tennis.
B1
Correct heights for ‘their scale’ (30 and 15) FT their (c) if possible: ‘their swimming’ = ‘their tennis’ AND either ‘their football’ = 2 x ‘their tennis’ or ‘their football’ = 60 – 2 x ‘their tennis’. If no scale visible, allow final B1 for bars drawn in correct proportions.
We'd like to use Google Analytics cookies to count visits and see which pages help most. They're optional, and the site works exactly the same either way. Privacy policy