
Foundation June 2017 Unit 1 Q5
5. Blues, Dragons, Ospreys and Scarlets are four Welsh rugby teams.
Aled asked a group of 170 pupils which of these 4 teams they preferred.
He then drew this bar chart to show the data that he had collected.
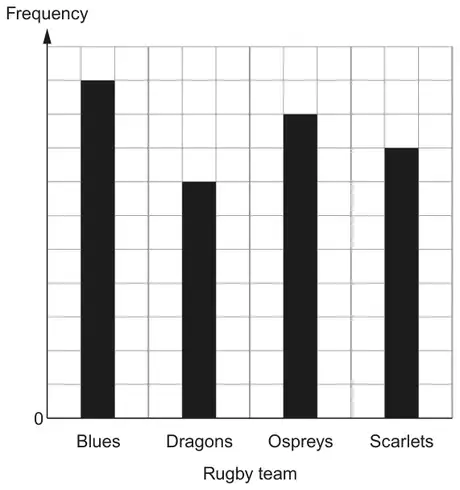
(a) Aled knew that 50 of these pupils said that they preferred the Blues.
Complete the table below. [3]
Complete the table below. [3]
| Rugby team preferred | Number of pupils |
|---|---|
| Blues | 50 |
| Dragons | |
| Ospreys | |
| Scarlets |
(b) A pupil is chosen at random from this group.
What is the probability that this pupil preferred the Blues? [2]
What is the probability that this pupil preferred the Blues? [2]
| Scheme | Marks | Comments |
|---|---|---|
| Dragons 35 Ospreys 45 Scarlets 40 | B3 | B2 for any two correct entries OR any one correct entry with evidence of correct scale indicated by at least one correct value and no incorrect value B1 for any one correct entry OR correct scale OR sight of ‘1 square = 5 pupils’ OR sight of ‘2 squares = 10 pupils’ |
| Scheme | Marks | Comments |
|---|---|---|
| 50/170 or equivalent ISW | B2 | B1 for a numerator of 50 in a fraction less than 1. B1 for a denominator of 170 in a fraction less than 1. B1 for use of words such as ‘50 out of 170’, ‘50 in 170’ or ‘50:170’. If words and correct notation seen, then ignore the words. |