
June 2022 Paper 2 Q11
11 The pre-release material contains information about the Median Income of Taxpayers and the Percentage of Pupils Achieving at Least 5 A*– C grades, including English and Maths, at the end of KS4 in different areas of London.
Alex is investigating whether there is a relationship between median income and the percentage of pupils achieving at least 5 A* – C grades, including English and Maths, at the end of KS4. Alex decides to use the first 12 rows of data for 2014–5 from the pre-release data as a sample. The sample is shown in Fig. 11.1.
| Area | Median Income of Taxpayers | Percentage of Pupils Achieving at Least 5 A*– C grades including English and Maths |
|---|---|---|
| City of London | 61100 | #N/A |
| Barking and Dagenham | 21800 | 54.0 |
| Barnet | 27100 | 70.1 |
| Bexley | 24400 | 55.0 |
| Brent | 22700 | 60.0 |
| Bromley | 28100 | 68.0 |
| Camden | 33100 | 56.4 |
| Croydon | 25100 | 59.6 |
| Ealing | 24600 | 62.1 |
| Enfield | 25300 | 54.5 |
| Greenwich | 24600 | 57.7 |
| Hackney | 26000 | 60.4 |
Fig. 11.1
Explain why Alex is not able to use the data for the City of London in this investigation. [2]
Fig. 11.2 shows a scatter diagram showing Percentage of Pupils against Median Income for all of the areas of London for which data is available.
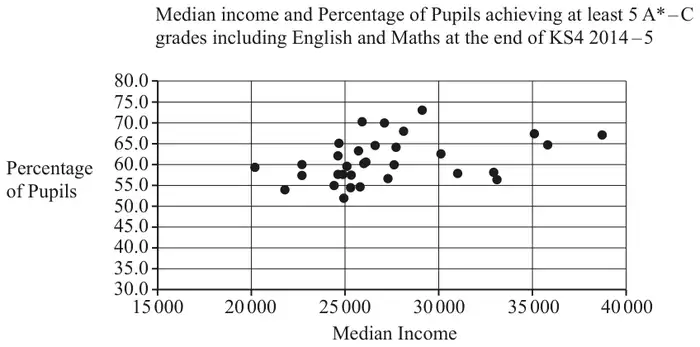
Alex identifies some outliers.
Alex then discards all the outliers and uses the LINEST function on a spreadsheet to obtain the following model.
\(P = 0.0009049M + 37.38\),
where \(P = \text{percentage of pupils}\) and \(M = \text{median income}\).
Alex states that more than 50% of the pupils in London achieved at least a grade C at the end of KS4 in English and Maths in 2014–5.
| Scheme | Marks | AO |
|---|---|---|
| Not a simple random sample, since not all sets of 12 possible samples have an equal chance of being chosen in this way. | B1 | 1.2 |
| [1] |
Notes
B1: Or equivalent
Not random as first 12 areas chosen
Convenience
| Scheme | Marks | AO |
|---|---|---|
| #N/A means there was no data available | B1 | 1.1 |
| and we cannot use median income on its own | B1 | 1.1 |
| [2] |
Notes
No data so no relationship can be established B1B1
LDS advantage
| Scheme | Marks | AO |
|---|---|---|
| the 3 largest \(x\)-values ringed | B1 | 1.1 |
| [1] |
Notes
B1: No extra points ringed
| Scheme | Marks | AO |
|---|---|---|
| 60.9(074) obtained which is close to 60.4 so a good fit | B1 | 3.4 |
| [1] |
Notes
B1: Must be some evidence of comparison
| Scheme | Marks | AO |
|---|---|---|
| 92.669 – 92.7 | B1 | 3.4 |
| [1] |
Notes
B1: awrt 92.7
| Scheme | Marks | AO |
|---|---|---|
| extrapolation | B1 | 3.5a |
| It would be an outlier. This model was calculated without outliers. | B1 | 2.3 |
| [2] |
Notes
Or equivalent
Causation with explanation
Might live in different boroughs than they go to school in.
City of London’s median would be an outlier compared to other areas
P=92.67 with median £61100 with relevant comment
Not many schools in City of London
Or other acceptable response
| Scheme | Marks | AO |
|---|---|---|
| from diagram, percentage is above 50% in all areas and data is for 5 or more passes including English and Maths, so there is evidence to support this statement | B1 | 2.3 |
| [1] |
Notes
B1: Not proves
All of the points on scatter graph are above 50% so suggests that statement is correct
percentage is above 50% in all areas and data is for 5 or more passe including English and Maths, so there is evidence to support this statement
LDS advantage