
June 2023 Paper 2 Q1
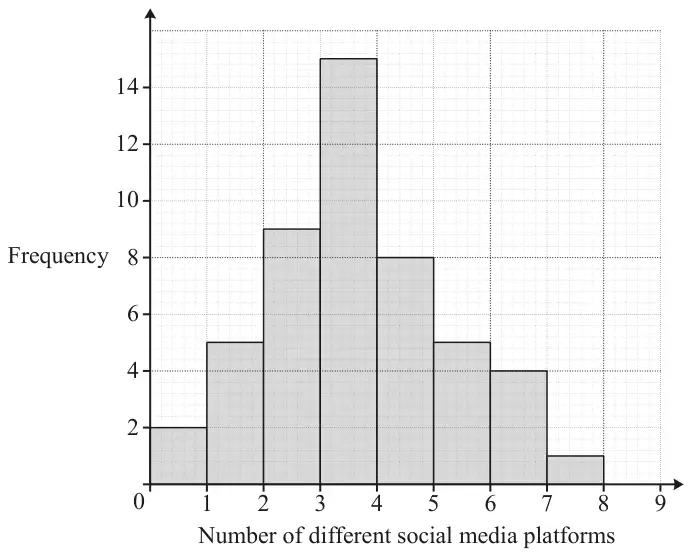
1 A researcher collects data concerning the number of different social media platforms used by school pupils on a typical weekday.
The frequency table for the data is shown below.
| Number of different social media platforms | 0 | 1 | 2 | 3 | 4 | 5 | 6 | 7 |
| Frequency | 2 | 5 | 9 | 15 | 8 | 5 | 4 | 1 |
The researcher uses software to represent the results in this diagram.
| Scheme | Marks | AO |
|---|---|---|
| The given data (on the graph) is continuous, not discrete oe | E1 | 2.4 |
| [1] |
Notes
Need a comment on the suitability of the histogram for the given data – we need a comment on the type(s) of data. The following score
-The given data was discrete, but this diagram represents continuous data
-The diagram is for continuous data, but the original data was discrete
-‘It is continuous data’ as the question asked about the histogram
- The data is discrete so there should be gaps between the bars
-‘The histogram uses ranges e.g. 6- 7 but the data is discrete and cannot have values between 6-7’ etc
Comments such as ‘there are no gaps between the bars’ or ‘it should be a bar chart’ or FD should be used or ‘it is discrete data’ (ambiguous) score 0
| Scheme | Marks | AO |
|---|---|---|
| (i) 3.183… to 3.184 or 3.18 BC Mark at most accurate | B1 | 1.1 |
| [1] | ||
| (ii) 1.61… to 1.62 BC OR 1.59… to 1.60 | B1 | 1.1 |
| [1] |
Notes
(i) B1: Exact value is 3.183673469 or \(3\frac{9}{49}\) or \(\frac{156}{49}\) o.e.
Allow if seen in (b)(ii) if not seen in (b)(i)
SC: 3.2 allow B1
(ii) B1: Exact value is 1.615980989 (sample)
Exact value is 1.599406387 (population)