
June 2022 Paper 2 Q6
6 The pre-release material contains information about employment rates in London boroughs.
The graph shows employment rates for Westminster between 2006 and 2019.
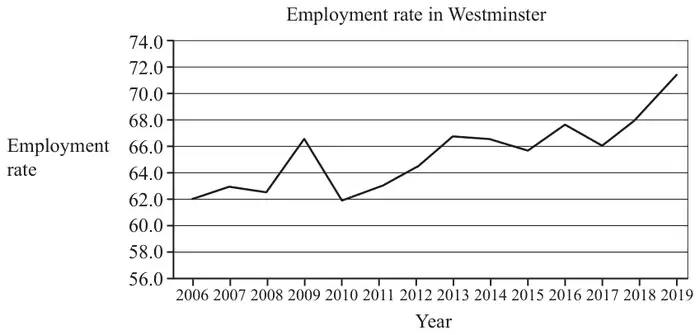
A local politician stated that the diagram shows that more than 60% of seventy-year-olds were in employment throughout the period from 2006 to 2019.
In order to estimate the employment rate in 2020, two different models were proposed using the LINEST function in a spreadsheet.
Model 1 (using all the data from 2006 onwards)
\(Y = 0.549x - 1040\),
Model 2 (using data from 2017 onwards)
\(Y = 2.65x - 5280\),
where \(Y = \text{employment rate}\) and \(x = \text{calendar year}\).
It was subsequently found that the employment rate in Westminster in 2020 was 68.4%.
| Scheme | Marks | AO |
|---|---|---|
| No evidence to support this statement as information in LDS is for 16 – 64 year olds | B1 | 2.4 |
| [1] |
Notes
B1: Oe This age group not in data set. Must refer to data set
LDS advantage
| Scheme | Marks | AO |
|---|---|---|
| Model 1: 68.98% | *B1 | 3.4 |
| Model 2: 73% | *B1 | 1.1 |
| Model 1 gives the best approximation since 68.98 is closer to true value | DB1 | 3.5a |
| [3] |
Notes
*B1 *B1: Reverse calculations
Model 1 2019 (2018.9)
Model 2 2018 (2018.3)
DB1: Model 1 sufficient or unambiguous indication
| Scheme | Marks | AO |
|---|---|---|
| Not appropriate since employment trends vary across the boroughs | B1 | 2.4 |
| [1] |
Notes
B1: Oe
Westminster employment trends differs to other boroughs
employment specific only to Westminster
LDS advantage
| Scheme | Marks | AO |
|---|---|---|
| eg Employment rates will increase forever or eg Employment rates will exceed 100% | B1 | 3.5b |
| [1] |
Notes
B1: Oe
not just increase
not exponential
Constant growth
Rise over time
Increase every year
No limit/maximum.