
Foundation November 2022 Paper 1 Q12
12. The table shows some of the values of \(y = 4x - 1\) for \(-1 \leqslant x \leqslant 1\).
| \(x\) | –1 | –0·5 | 0 | 0·5 | 1 |
| \(y = 4x - 1\) | –5 | 1 | 3 |
(a) Complete the table above. [2]
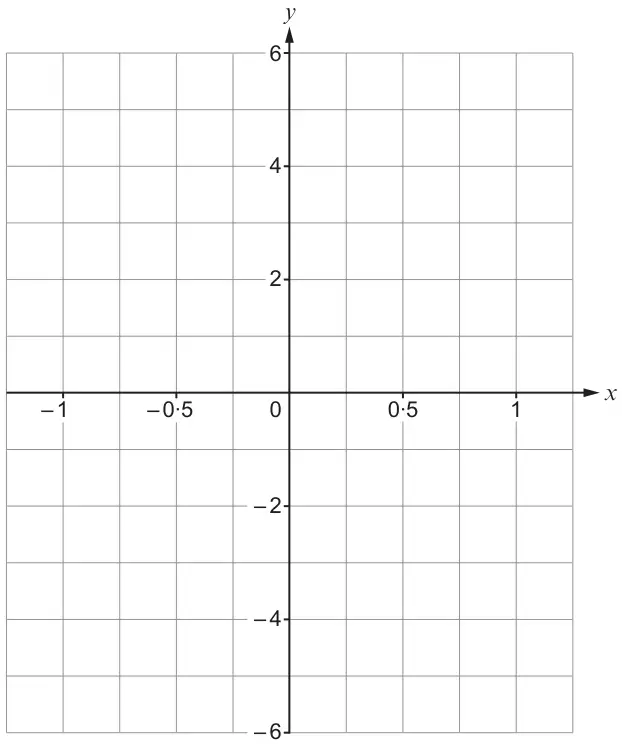
(b) On the grid below, draw the graph of \(y = 4x - 1\) for \(-1 \leqslant x \leqslant 1\). [2]
| Scheme | Marks | Comments |
|---|---|---|
| \(-3\), \(-1\) | B2 | B1 for each |
| Scheme | Marks | Comments |
|---|---|---|
| Correct line from at least (\(-1\), \(-5\)) to (1, 3) 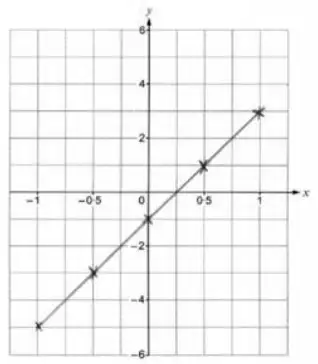 | B2 | Mark intention of straight-line. B1 for correct truncated line (at least the length of 2 points) OR B1 FT for 4 or 5 points plotted correctly (using their table of values) |
| (4) |