12. Sandy grows fruit to sell from her market stall.
(a)
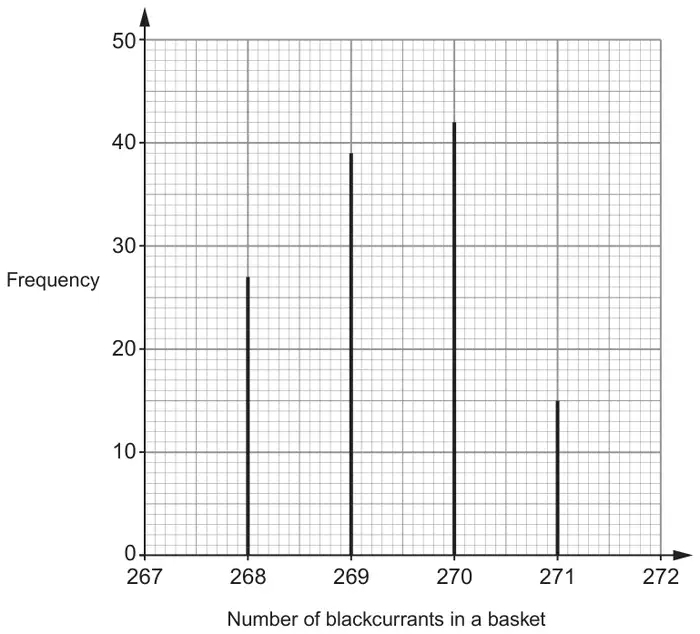
The vertical line graph shows information about the baskets of blackcurrants Sandy sold last week.
(i) How many baskets of blackcurrants did Sandy sell last week? [1]
(ii) What fraction of the baskets of blackcurrants Sandy sold last week contained more than 269 blackcurrants? [2]
(b)
Sandy sells her raspberries in boxes. The frequency table shows the numbers of raspberries in 130 boxes.
Number of raspberries
Frequency
45
7
46
24
47
35
48
37
49
18
50
9
(i) Find the range of the number of raspberries in a box. [1]
(ii) Find the median number of raspberries in a box. [2]
(iii) Calculate the mean number of raspberries in a box. [3]
(iv)
Sandy says:
“The modal number of raspberries in a box is more than the mean number of raspberries in a box.”
Is Sandy correct?
Yes ☐ No ☐
Show how you decide. [1]
Mark scheme (a)
Scheme
Marks
Comments
(i) 123
B1
(ii) \(\dfrac{57}{123}\) oe
B2
FT ‘their 123’ provided it is greater than 57. If all four values are seen above with only an error in the 42 or the 15 FT the correct sum of ‘their 42’ + 15 or 42 + ‘their 15’ e.g. \(\dfrac{19}{41}\); B1 for sight of 57 or B1 for \(\frac{42+15}{123}\)
Mark scheme (b)
Scheme
Marks
Comments
(i) 5
B1
(ii) 47
B2
B1 for indicating e.g. between 65th and 66th data point; allow 65th or 66th or 130 ÷ 2 = 65 or 131 ÷ 2 = 65.5 for B1
We'd like to use Google Analytics cookies to count visits and see which pages help most. They're optional, and the site works exactly the same either way. Privacy policy