
Foundation November 2020 Paper 2 Q7
7.
(a)
At 8 a.m. the temperature in a new freezer is 22 °C.
The temperature decreases at 4 °C per hour.
At what time will it reach −14 °C? [2]
(b) 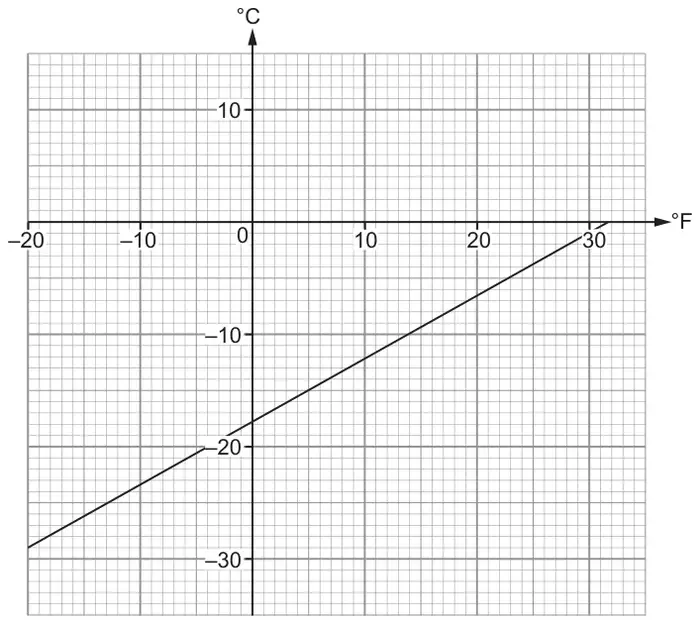
The graph below can be used to convert between degrees Fahrenheit (°F) and degrees Celsius (°C).
Use the graph to convert the temperature −14 °C to °F. [1]
| Scheme | Marks | Comments |
|---|---|---|
| (22 – –14) ÷ 4 or 9 or equivalent | M1 | Allow repeated subtraction of 4 nine times with one arithmetic error |
| 17(:)00 or 5 p.m. | A1 | An answer of 5 a.m. or 5 o’clock implies M1A0 |
| Scheme | Marks | Comments |
|---|---|---|
| 7 (°F) | B1 | Allow 6.5 to 7.5 inclusive. |
| (3) |