
Foundation November 2019 Paper 2 Q8
8.
(a)
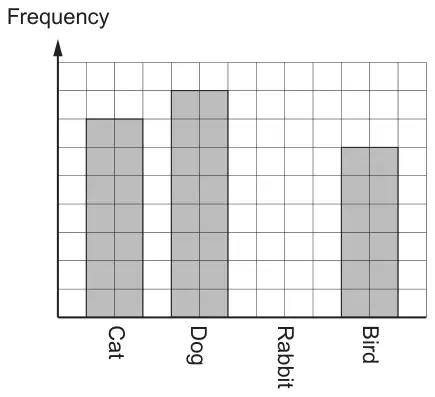
The table and bar chart below show some information about the number of pets seen by a vet on Tuesday.
| Type of pet | Frequency |
|---|---|
| Cat | 14 |
| Dog | ……… |
| Rabbit | 8 |
| Bird | ……… |
(i) Using the information above, complete the table and draw the bar for rabbit. [3]
(ii) Which is the modal type of pet? [1]
(b)
The table below shows the number of pets seen by the vet on Wednesday.
| Type of pet | Frequency |
|---|---|
| Cat | 10 |
| Dog | 17 |
| Rabbit | 9 |
| Bird | 12 |
| Total | 48 |
(i)
The vet decides to show this information in a pie chart.
Calculate the angle used to show the cats. [2]
(ii)
A pet is chosen at random from the pets that were seen on Wednesday.
What is the probability that this pet is a dog? [1]
| Scheme | Marks | Comments |
|---|---|---|
| (i) (dog) 16 AND (Bird) 12 completed into the table. | B2 | B1 for 16 or 12 or for any indication that the vertical axis is 2 pets to each square. |
| Draws a bar with height 4 squares and width 2 squares. | B1 | |
| (ii) Dog | B1 |
| Scheme | Marks | Comments |
|---|---|---|
| (i) 75° | B2 | B1 for sight of 360 × 10 ÷ 48 or 7.5 or 0.2083(3…) or equivalent (e.g. 20.83%) |
| (ii) 17/48 or equivalent | B1 | ISW |
| (7) |