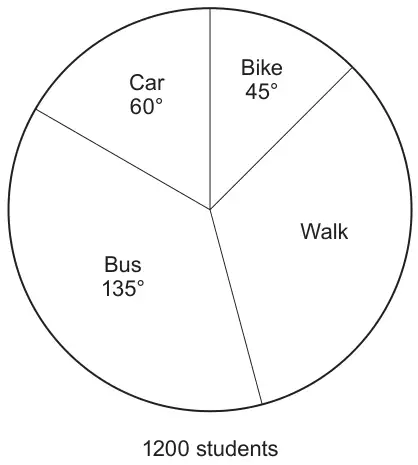
15. This pie chart shows how 1200 students travel to school.
(a)
(i) Calculate the fraction of students who walk to school. [2]
(ii) Calculate the number of students who walk to school. [1]
(b)
(i) Draw a bar chart to show the number of students and how they travel to school. [4]
(ii) Give one advantage or disadvantage of the bar chart compared to the pie chart. [1]
Mark scheme (a)
Scheme
Marks
Comments
(i) 360 – (135+45+60) OR 360 – 240 OR 120
M1
\(\frac{120}{360}\) or equivalent
A1
Any simplification must be correct. If M0, award SC1 for a fraction with a denominator of 360 AND a numerator of 118 or 119 or 121 or 122.
(ii) (\(\frac{1}{3}\) of 1200 = ) 400
B1
FT ‘their \(\frac{120}{360}\)’
Mark scheme (b)
Scheme
Marks
Comments
(i) Calculation of frequencies
M1
Award M1 for angle/360 x 1200 OR Sight of 3 correct frequencies.
Bike 150, car 200, bus 450, walk 400
A1
Fully correct bar chart will imply M1A1.
Correctly drawn bar graph.
B2
Award B1 for correct labelling of axes and scale. B1 for correct bar heights.
(ii) One valid advantage or disadvantage, e.g. ‘bar graph easier to read the frequency’ or ‘pie chart more difficult to read the frequency’ or ‘bar chart clearer’ or ‘the bar graph is easier to draw’, or ‘in the pie chart, it is easier to see the proportions of the 1200 students who use each type of travel’.
We'd like to use Google Analytics cookies to count visits and see which pages help most. They're optional, and the site works exactly the same either way. Privacy policy