
Foundation June 2018 Paper 2 Q6
6 This bar chart shows the average monthly expenditure, by category, of households in a particular town in 2005 and 2015.
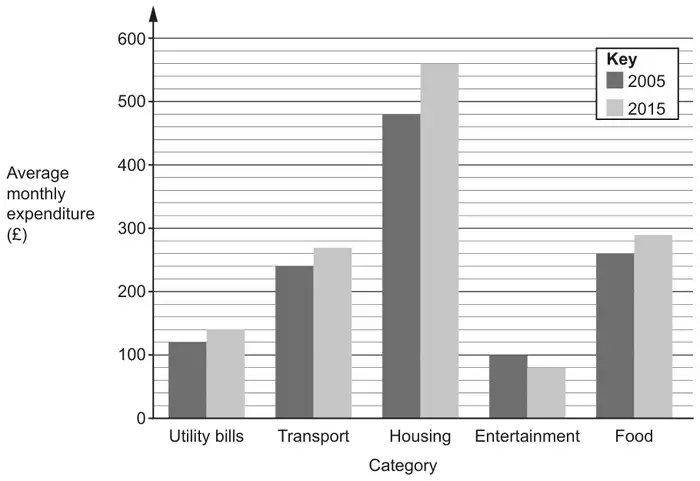
(a) In which category was there a decrease in the average monthly expenditure between 2005 and 2015? [1]
(b) How much more was the average monthly expenditure on housing in 2015 than in 2005? [2]
(c) The total average monthly expenditure in 2005 was £1200.
What percentage of this was spent on transport? [3]
| Answer | Marks | Part marks and guidance | |
|---|---|---|---|
| Entertainment | 1 | ||
| Answer | Marks | Part marks and guidance | |
|---|---|---|---|
| 80 | 2 | B1 for 480 or 560 seen or 4 \(\times\) 20 | For B1, could be seen on bar chart |
| Answer | Marks | Part marks and guidance | |
|---|---|---|---|
| 20 | 3 | M2 for \(\dfrac{240}{1200} \times 100\) oe Or M1 for \(\dfrac{240}{1200}\) oe or 10% is 120 soi or for \(\dfrac{\textit{their}\ 240}{1200} \times 100\) oe | Their 240 a value between 200 and 280 or the value 510 |