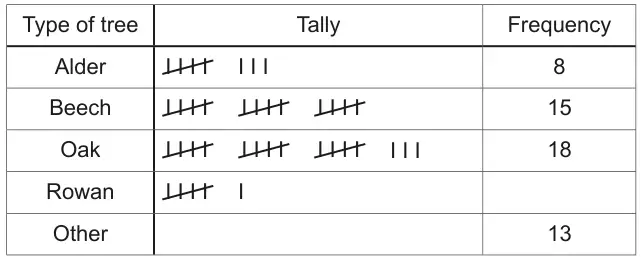
1 George recorded all the different types of tree in a wood.
(a) His results are shown in this table.
Complete the table.
[2]
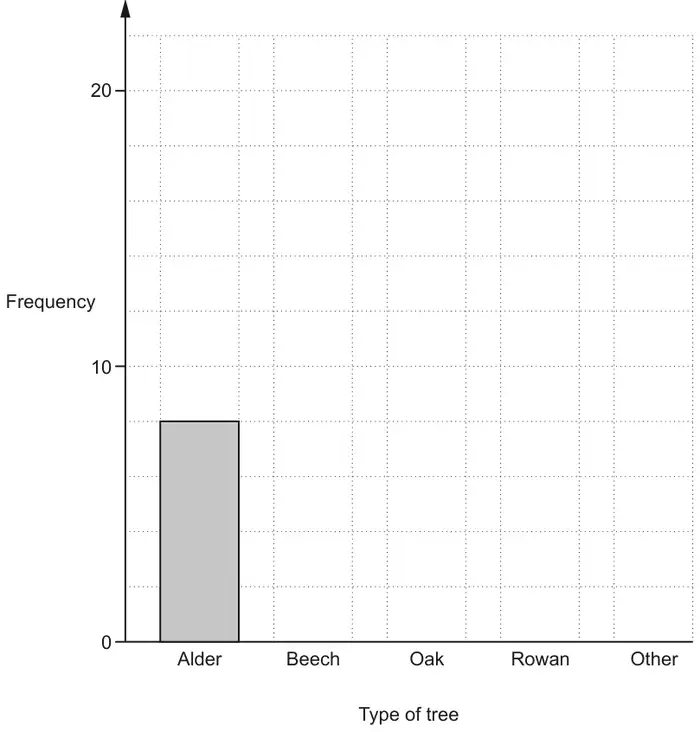
(b) Complete the bar chart to show George’s results.
[2]
(c) George found 60 trees altogether in the wood.
What percentage of the trees were oak trees? [2]
Mark scheme (a)
Answer
Marks
Part marks and guidance
[Rowan Frequency] 6
[Other Tally]
2
B1 for each
Mark scheme (b)
Answer
Marks
Part marks and guidance
All heights correct and all bars correctly placed
2FT
FTtheir Rowan frequency B1 for two correct heights or all heights correct with unequal widths
Correct heights are 15, 18, 6, 13 Tolerance on Oak and Rowan \(\pm\)1mm by eye Tolerance for Beech and Other closer to middle of rectangle than the top or bottom Allow good freehand if within tolerance