
Foundation June 2019 Paper 1 Q10
10. Twelve members of a running club take part in three runs.
The table shows the times taken, in hours, by the 12 runners to complete the first run.
| 1·2 | 0·9 | 2·5 | 1·3 | 2·1 | 2·6 |
| 1·8 | 2·0 | 2·1 | 2·1 | 1·5 | 2·2 |
A runner was chosen at random from those who took part in the first run.
Find the probability that this runner took at most 1·5 hours. [1]
The scatter diagram shows the times it took 10 of the runners to complete the other two runs.
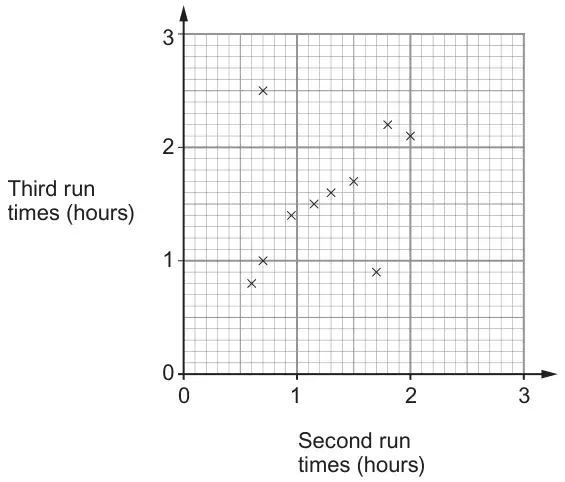
One of these 10 runners was injured during the third run and walked most of the way.
Circle the plot most likely to represent this runner on the scatter diagram. [1]
The times, in hours, taken by the remaining 2 runners were:
| Runner 11 | Runner 12 | |
|---|---|---|
| Second run | 1·8 | 2·2 |
| Third run | 1·9 | 2·4 |
Plot these times on the scatter diagram. [2]
Using the information on the completed scatter diagram, what was the difference between the fastest time for the second run and the fastest time for the third run?
Give your answer in minutes. [3]
Time difference = .............................. minutes
| Scheme | Marks | Comments |
|---|---|---|
| (i) 2.1 (hours) | B1 | |
| (ii) 1.7 (hours) | B1 | |
| (iii) \(\dfrac{4}{12}\) oe, ISW | B1 |
| Scheme | Marks | Comments |
|---|---|---|
| (i) Plot at (0.7, 2.5) circled | B1 | |
| (ii) Correct plots at (1.8, 1.9) and (2.2, 2.4) only | B2 | B1 for one correct plot; ignoring extra plots |
| (iii) 0.6 (second run) or 0.8 (third run) identified | B1 | si |
| \((0.8 - 0.6) \times 60\) or 48 – 36 or 2 × 6 (minutes) oe | M1 | FT ‘their difference’ provided one value correct; |
| 12 (minutes) | A1 | CAO If no marks then SC1 for \((2.5 - 2.2) \times 60\) leading to 18 minutes |
| (9) |