
4400 Higher November 2004 Paper 4 Q10
10 The table gives information about the speeds, in km/h, of 200 cars passing a speed checkpoint.
| Speed (\(v\) km/h) | Frequency |
|---|---|
| \(30 \lt v \leqslant 40\) | 20 |
| \(40 \lt v \leqslant 50\) | 76 |
| \(50 \lt v \leqslant 60\) | 68 |
| \(60 \lt v \leqslant 70\) | 28 |
| \(70 \lt v \leqslant 80\) | 8 |
(a) Write down the modal class. (1)
(b) Work out an estimate for the probability that the next car passing the speed checkpoint will have a speed of more than 60 km/h. (2)
(c) Complete the cumulative frequency table.
(1)
| Speed (\(v\) km/h) | Cumulative frequency |
|---|---|
| \(30 \lt v \leqslant 40\) | |
| \(30 \lt v \leqslant 50\) | |
| \(30 \lt v \leqslant 60\) | |
| \(30 \lt v \leqslant 70\) | |
| \(30 \lt v \leqslant 80\) |
(d) On the grid, draw a cumulative frequency graph for your table.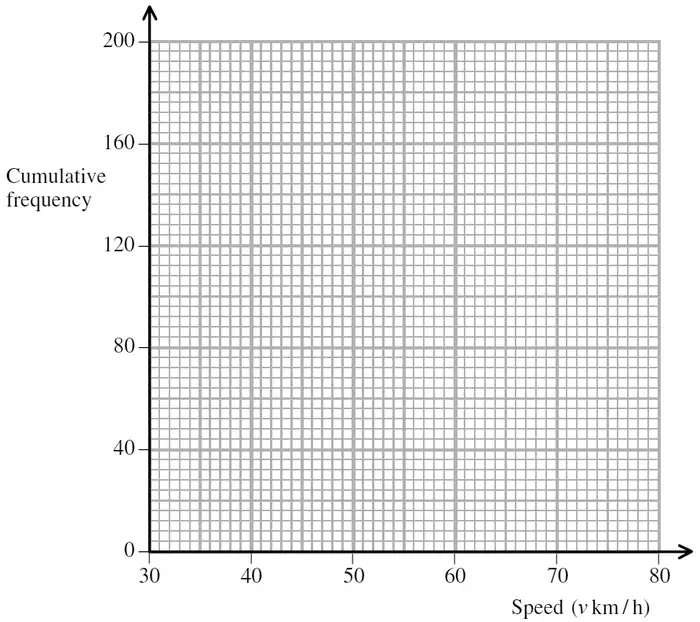
(e) Use your graph to find an estimate for the inter-quartile range of the speeds.
Show your method clearly. (2)
Show your method clearly. (2)
| Scheme | Marks |
|---|---|
| \(40 \lt v \leqslant 50\) | B1 |
| (1) |
| Scheme | Marks |
|---|---|
| \(\dfrac{36}{200}\) | M1 |
| 0.18 oe | A1 |
| (2) |
Notes
M1: for fraction with a denominator of 200
A1: for numerator of 36
| Scheme | Marks |
|---|---|
| 20, 96, 164, 192, 200 | B1 |
| (1) |
| Scheme | Marks |
|---|---|
| Points correct | B1 |
| Curve or lines | B1 |
| (2) |
Notes
B1: ft
| Scheme | Marks |
|---|---|
| 50 (or 50¼) & 150 (or 150¾) indicated | M1 |
| ~ 13 | A1 |
| (2) | |
| (8 marks) |
Notes
A1: ft from graph if B1 or B2 in (d)