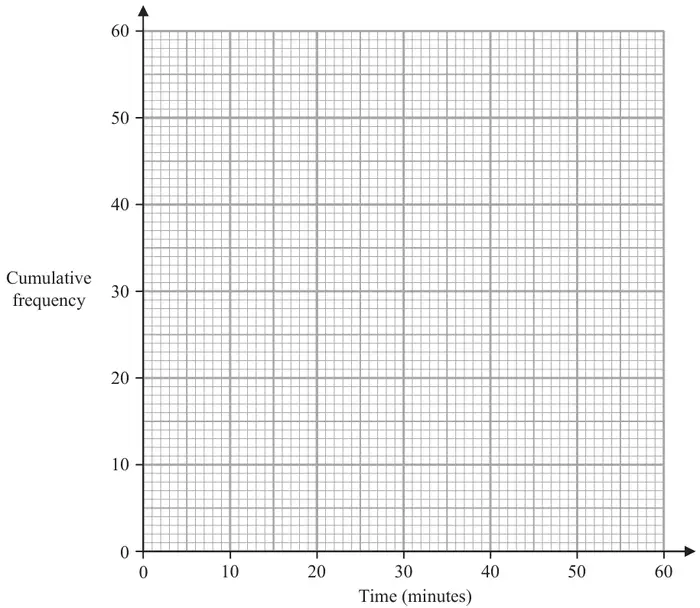
13 The frequency table gives information about the times, in minutes, that 60 people took to complete a puzzle.
Time (\(t\) minutes)
Frequency
\(0 \lt t \leqslant 10\)
8
\(10 \lt t \leqslant 20\)
13
\(20 \lt t \leqslant 30\)
12
\(30 \lt t \leqslant 40\)
17
\(40 \lt t \leqslant 50\)
7
\(50 \lt t \leqslant 60\)
3
(a) Complete the cumulative frequency table. (1)
Time (\(t\) minutes)
Cumulative frequency
\(0 \lt t \leqslant 10\)
\(0 \lt t \leqslant 20\)
\(0 \lt t \leqslant 30\)
\(0 \lt t \leqslant 40\)
\(0 \lt t \leqslant 50\)
\(0 \lt t \leqslant 60\)
(b) On the grid below, draw a cumulative frequency graph for your table. (2)
(c) Use your graph to find an estimate for the median time. (1)
(d) Use your graph to find an estimate for the number of these people who took more than 45 minutes to complete the puzzle. (2)
Mark scheme (a)
Scheme
Marks
8, 21, 33, 50, 57, 60
B1
(1)
Mark scheme (b)
Scheme
Marks
USE OVERLAY
(NB A histogram/bar chart type graph scores zero marks unless a CF diagram is drawn over their histogram/bar chart)
(Ignore any part of the graph before (10, 8))
M1
Working not required, so correct answer scores full marks (unless from obvious incorrect working) Answer: Correct cf diagram
A1
(2)
Notes
M1: for at least 5 points plotted correctly at end of interval or ft from an ascending table (ft from a table with only one arithmetic error that may be continued through table) for all 6 points plotted consistently within each interval in the freq table at the correct height
A1: for fully correct plotting with points joined accept curve or line segments accept curve that is not joined at (0, 0)
Mark scheme (c)
Scheme
Marks
27 – 28
B1
(1)
Notes
B1: accept answer in the range or ft an ascending graph
Mark scheme (d)
Scheme
Marks
(60 –) 54
M1
Working not required, so correct answer scores full marks (unless from obvious incorrect working) Answer: 5 or 6 or 7
A1
(2)
(6 marks)
Notes
M1: ft for a line going up from the \(x\)-axis at 45 to the line and across to the \(y\)-axis or for a mark on the line at the correct point or for a correct reading from the vertical scale eg 54 or 53.5
A1: accept integer value 5 or 6 or 7 or ft from their ascending graph for an integer value
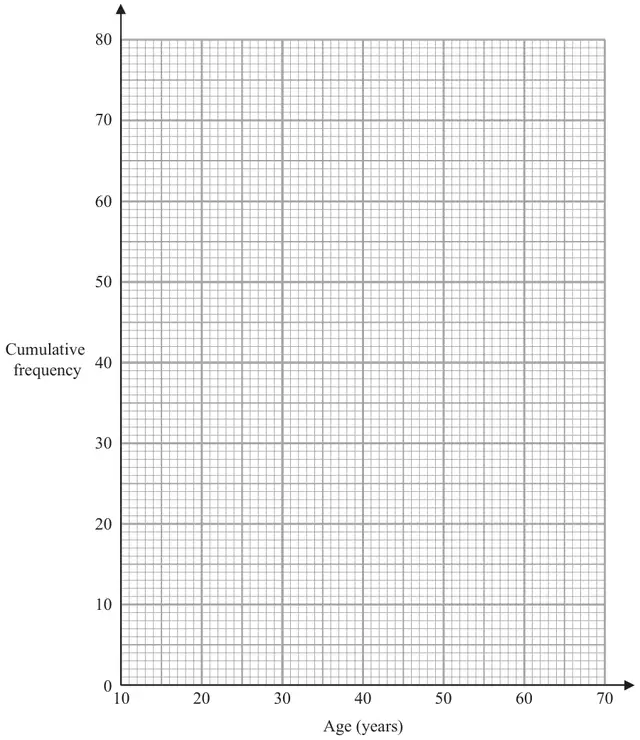
12 The table gives information about the ages of 80 people in a cinema.
Age (\(n\) years)
Frequency
\(10 \lt n \leqslant 20\)
12
\(20 \lt n \leqslant 30\)
15
\(30 \lt n \leqslant 40\)
20
\(40 \lt n \leqslant 50\)
18
\(50 \lt n \leqslant 60\)
9
\(60 \lt n \leqslant 70\)
6
(a) Complete the cumulative frequency table. (1)
Age (\(n\) years)
Cumulative frequency
\(10 \lt n \leqslant 20\)
\(10 \lt n \leqslant 30\)
\(10 \lt n \leqslant 40\)
\(10 \lt n \leqslant 50\)
\(10 \lt n \leqslant 60\)
\(10 \lt n \leqslant 70\)
(b) On the grid below, draw a cumulative frequency graph for your table. (2)
(c) Use your graph to find an estimate for the percentage of the 80 people who are more than 46 years of age. Give your answer correct to the nearest whole number. (3)
Mark scheme (a)
Scheme
Marks
12, 27, 47, 65, 74, 80
B1
(1)
Mark scheme (b)
Scheme
Marks
M1
Correct answer scores full marks (unless from obvious incorrect working) Answer: correct cf graph
A1
(2)
Notes
M1: ft from table for at least 5 points plotted correctly at end of interval or ft from sensible table (ft from a table with only one arithmetic error that may be continued through table) for all 6 points plotted consistently within each interval in the freq table at the correct height
A1: accept curve or line segments accept curve that is not joined at (10, 0)
\(\dfrac{\text{``}{58}\text{''}}{80}(\times 100)(= 0.725 \text{ or } 72.5)\)
M1ft
Correct answer scores full marks (unless from obvious incorrect working) Answer: 28
A1ft
(3)
(6 marks)
Notes
M1ft: a line up from 46 to their graph and a line across to the vertical axis or a mark on the curve at the correct point and a mark on the vertical axis at the correct point or a reading of 57 - 59 from their cf graph or a value of 21 – 23 or a correct value for their graph must be ascending (could be a lobf)
M1ft: method to find the fraction or percentage of people aged over or under 46 ft from their graph or a value in the range 0.26 - 0.29 or 0.71 - 0.74 or 71 (%) - 74(%)
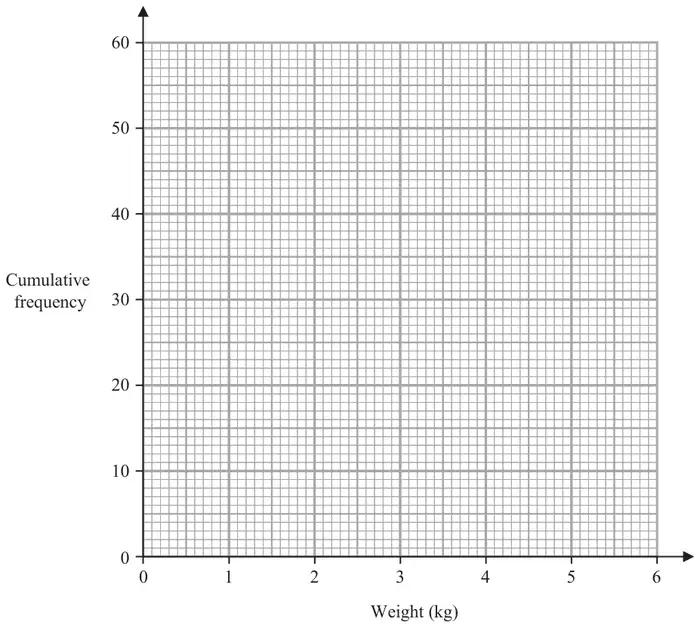
13 The frequency table gives information about the weights, in kilograms, of 60 parcels in a delivery van.
Weight (\(w\) kilograms)
Frequency
\(0 \lt w \leqslant 1\)
4
\(1 \lt w \leqslant 2\)
15
\(2 \lt w \leqslant 3\)
20
\(3 \lt w \leqslant 4\)
11
\(4 \lt w \leqslant 5\)
6
\(5 \lt w \leqslant 6\)
4
(a) Complete the cumulative frequency table.
Weight (\(w\) kilograms)
Cumulative frequency
\(0 \lt w \leqslant 1\)
\(0 \lt w \leqslant 2\)
\(0 \lt w \leqslant 3\)
\(0 \lt w \leqslant 4\)
\(0 \lt w \leqslant 5\)
\(0 \lt w \leqslant 6\)
(1)
(b) On the grid below, draw a cumulative frequency graph for your table. (2)
(c) Use your graph to find an estimate for the median weight of the 60 parcels. (1)
(d) Use your graph to find an estimate for the number of these parcels that weigh more than 3.7 kilograms. (2)
Mark scheme (a)
Scheme
Marks
4, 19, 39, 50, 56, 60
B1
(1)
Mark scheme (b)
Scheme
Marks
B2
(2)
Notes
B2:(use overlay) Fully correct cf graph – points at ends of intervals and joined with curve or line segments. If not B2 then B1(ft from a table with only one arithmetic error that may be continued through table) for 5 or 6 of their points at ends of intervals and joined with curve or line segments OR for 5 or 6 points plotted correctly at ends of intervals not joined OR for 5 or 6 points from table plotted consistently within each interval (not at upper ends of intervals) at their correct heights and joined with smooth curve or line segments. (ignore part from 0 to first plotted point when looking at curve/line segments)
Mark scheme (c)
Scheme
Marks
ft an increasing graph as student is asked to ‘use your graph…’ Answer: 2.3 – 2.7
B1ft
(1)
Notes
B1ft: Any value in range if an increasing graph is drawn (ft their graph reading across at 30 or 30.5)
Mark scheme (d)
Scheme
Marks
ft an increasing graph (if reading can be taken) as student is asked to ‘use your graph…’
M1
If a correct graph is drawn and answer is in the given range, then award the marks Answer: 12, 13, 14 or 15
A1ft
(2)
(6 marks)
Notes
M1: For a correct method to take a reading at 3.7 kg eg 45 – 48 or a correct value for their graph (one square tolerance)
A1ft: Award full marks for an answer in the range if a correct cf graph is drawn and ft their increasing graph if value outside range Must be a whole number value (non-integer value gains M1 only)