4400 Higher June 2004 Paper 3 Q9

EdexcelHigherOld spec11 marksCumulative FrequencyGrouped Data

9 The grouped frequency table gives information about the distance each of 150 people travel to work.

Distance travelled
(\(d\) km)
Frequency
\(0 \lt d \leqslant 5\)34
\(5 \lt d \leqslant 10\)48
\(10 \lt d \leqslant 15\)26
\(15 \lt d \leqslant 20\)18
\(20 \lt d \leqslant 25\)16
\(25 \lt d \leqslant 30\)8
(a) Work out what percentage of the 150 people travel more than 20 km to work. (2)
(b) Work out an estimate for the mean distance travelled to work by the people. (4)
(c) Complete the cumulative frequency table.
Distance travelled
(\(d\) km)
Cumulative
frequency
\(0 \lt d \leqslant 5\) 
\(0 \lt d \leqslant 10\) 
\(0 \lt d \leqslant 15\) 
\(0 \lt d \leqslant 20\) 
\(0 \lt d \leqslant 25\) 
\(0 \lt d \leqslant 30\) 
(1)
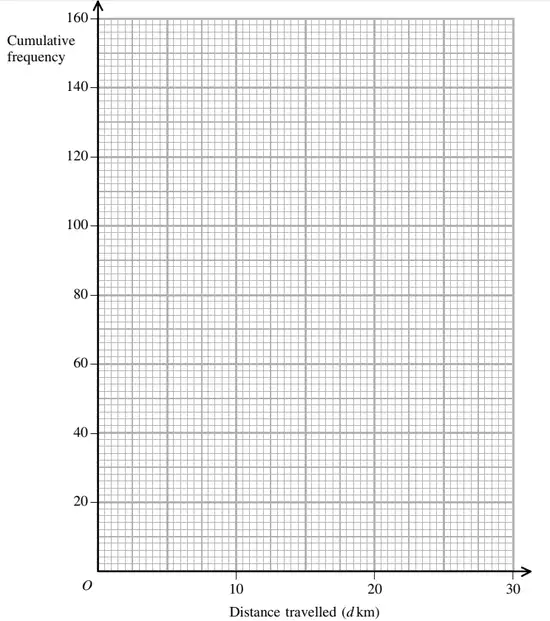
(d) On the grid, draw a cumulative frequency graph for your table.
Grid: cumulative frequency 0 to 160 against distance travelled d km from 0 to 30
(2)
(e) Use your graph to find an estimate for the median of the distance travelled to work by the people.
Show your method clearly. (2)