
4400 Higher June 2005 Paper 3 Q10
10 The table gives information about the ages, in years, of the 80 members of a sports club.
| Age (\(t\) years) | Frequency |
|---|---|
| \(10 < t \leqslant 20\) | 8 |
| \(20 < t \leqslant 30\) | 38 |
| \(30 < t \leqslant 40\) | 28 |
| \(40 < t \leqslant 50\) | 4 |
| \(50 < t \leqslant 60\) | 2 |
(a) Work out an estimate for the mean age of the 80 members. (4)
(b) Complete the cumulative frequency table.
| Age (\(t\) years) | Cumulative frequency |
|---|---|
| \(10 < t \leqslant 20\) | |
| \(10 < t \leqslant 30\) | |
| \(10 < t \leqslant 40\) | |
| \(10 < t \leqslant 50\) | |
| \(10 < t \leqslant 60\) |
(1)
(c) On the grid, draw a cumulative frequency graph for your table.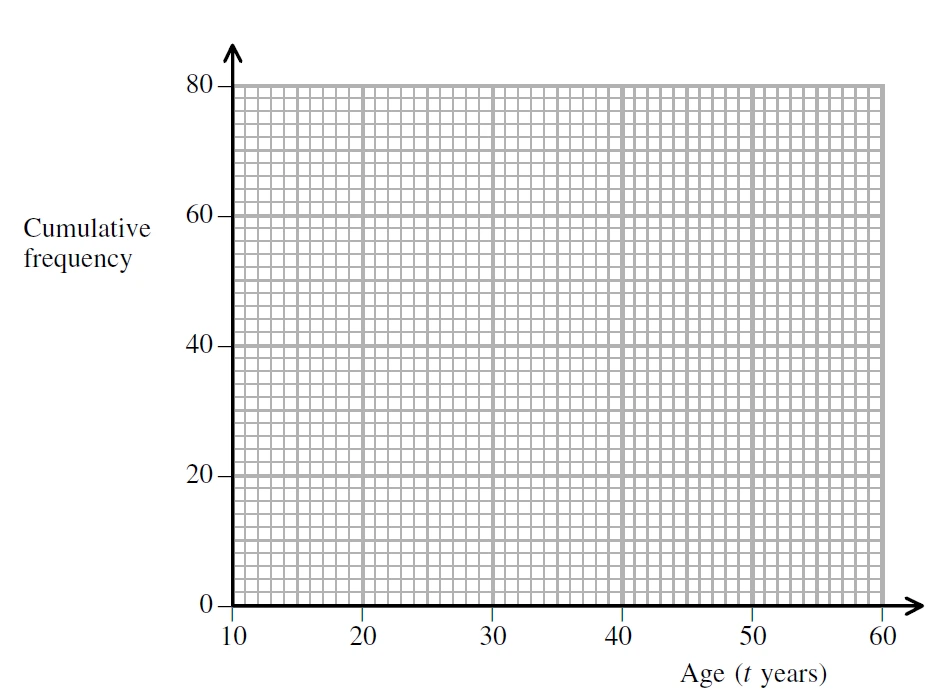
(2)
(d) Use your graph to find an estimate for the median age of the members of the club.
Show your method clearly. (2)
Show your method clearly. (2)
| Scheme | Marks |
|---|---|
| 15 × 8 + 25 × 38 + 35 × 28 + 45 × 4 + 55 × 2 = 120 + 950 + 980 + 180 + 110 = 2340 | M1 M1 |
| 2340 ÷ 80 | M1 |
| 29.25 | A1 |
| (4) |
Notes
M1: For products \(m \times f\) where \(m\) is consistent inc end points
M1: (dep) for use of midpoints (15, 25, … or 15.5, 25.5, …)
M1: (dep on 1st M1) for adding and ÷ 80
A1: Accept 29, 29.2, 29.3 if first two M1s scored (If 15.5, 25.5, … used, mean = \(\frac{2380}{80}\) = 29.75)
| Scheme | Marks |
|---|---|
| 8, 46, 74, 78, 80 | B1 |
| (1) |
Notes
B1: cao
| Scheme | Marks |
|---|---|
| Points correct | B1 |
| Curve or line segments | B1 |
| (2) |
Notes
B1: ±½ sq ft from sensible table
B1: ft from points if 4 or 5 points correct or if points are plotted consistently within each interval at the correct heights
| Scheme | Marks |
|---|---|
| use of 40 (or 40.5) on graph or 40th (or 40.5th) stated | M1 |
| ~29 | A1 |
| (2) | |
| (9 marks) |
Notes
M1: For use of 40 (or 40.5) on graph or 40th (or 40.5th) stated
A1: If M1 scored, ft from cumulative frequency graph
If no working, follow through only from correct curve