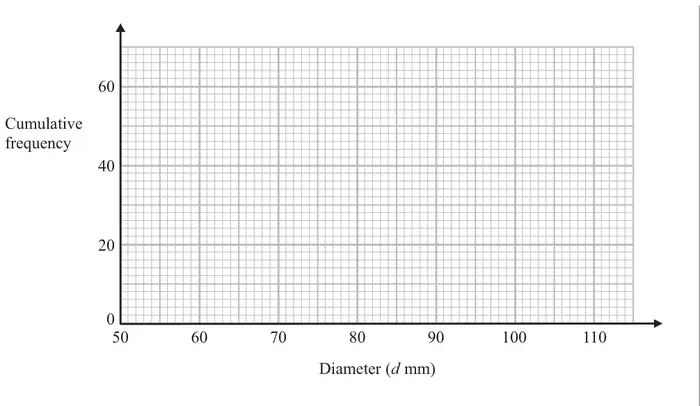
12 The cumulative frequency table shows information about the diameters of 60 oranges.
Diameter (\(d\) mm)
Cumulative frequency
\(50 \lt d \leqslant 60\)
12
\(50 \lt d \leqslant 70\)
42
\(50 \lt d \leqslant 80\)
54
\(50 \lt d \leqslant 90\)
57
\(50 \lt d \leqslant 100\)
59
\(50 \lt d \leqslant 110\)
60
(a) On the grid, draw a cumulative frequency graph for the table.(2)
(b) Use your graph to find an estimate for the median diameter of the 60 oranges. (2)
Mark scheme (a)
Scheme
Marks
Points correct
B1
Curve or line segments
B1
(2)
Notes
B1: ± ½ sq
B1: ft from points if 4 or 5 correct or if points are plotted consistently within 50-60, 60-70, 70-80 etc at the correct heights Ignore any attempt at curve to left of first plotted point
Mark scheme (b)
Scheme
Marks
30 (or 30.5) indicated on cumulative frequency graph or stated
M1
approx 66
A1
(2)
Notes
M1: for 30 (or 30.5) indicated on cumulative frequency axis or stated
A1: If M1 scored, ft from their cumulative frequency graph If M1 not scored, ft only from correct curve & if answer is correct (± ½ sq tolerance) award M1 A1