
4MA0 Higher January 2014 Paper 3 Q8
8 A box contains 80 tea bags.
The table shows information about the weight of each tea bag.
| Weight (\(w\) grams) | Number of tea bags |
|---|---|
| \(2.8 \lt w \leqslant 2.9\) | 2 |
| \(2.9 \lt w \leqslant 3.0\) | 4 |
| \(3.0 \lt w \leqslant 3.1\) | 22 |
| \(3.1 \lt w \leqslant 3.2\) | 32 |
| \(3.2 \lt w \leqslant 3.3\) | 14 |
| \(3.3 \lt w \leqslant 3.4\) | 6 |
(a) Work out the percentage of the 80 tea bags that weigh more than 3.1 grams. (2)
(b) Work out an estimate for the total weight of the 80 tea bags.
Use halfway values of 2.85 grams, 2.95 grams, ... (3)
Use halfway values of 2.85 grams, 2.95 grams, ... (3)
Here is a cumulative frequency graph for the weights of the 80 tea bags.
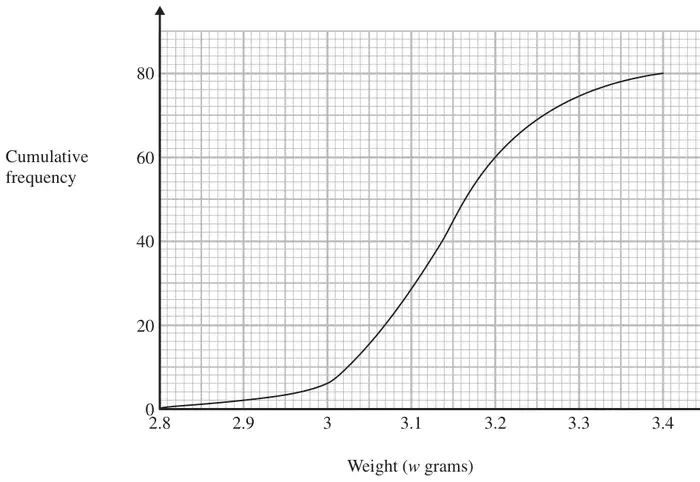
(c) Use the graph to find an estimate for the number of tea bags which weighed more than 3.25 grams. (2)
(d) Use the graph to find an estimate for the interquartile range of the weights of the tea bags. (2)
| Scheme | Marks |
|---|---|
| \(\dfrac{32 + 14 + 6}{80} \times 100\) oe | M1 |
| 65 | A1 |
| (2) |
Notes
M1: for \(\dfrac{32 + 14 + 6}{80}\) or 0.65
A1: cao
| Scheme | Marks |
|---|---|
| 2.85 × 2 + 2.95 × 4 + 3.05 × 22 + 3.15 × 32 +3.25 × 14 + 3.35 ×6 or 5.7 + 11.8 + 67.1 + 100.8 + 45.5 + 20.1 | M1 |
| M1 | |
| 251 | A1 |
| (3) |
Notes
M1: for at least two products \(f \times x\) consistently within intervals (inc end points)
M1: for complete correct method (condone any one error)
NB. products do not need to be evaluated
A1: cao
| Scheme | Marks |
|---|---|
| Use of \(w = 3.25\) on graph | M1 |
| 10 or 11 or 12 | A1 |
| (2) |
Notes
M1: for correct use of \(w = 3.25\) on graph or implied by any value in the range 68 – 70 stated
A1: accept any value in range 10-12 inc
| Scheme | Marks |
|---|---|
| 20 and 60 or 20¼ and 60¾ indicated on cumulative frequency axis or stated | M1 |
| 0.13 | A1 |
| (2) | |
| (9 marks) |
Notes
M1: or 3.2 and 3.07 indicated on graph or in working space
A1: accept an answer that follows through from their correct lines on graph and correct readings