
C3 January 2008 Q4
4.
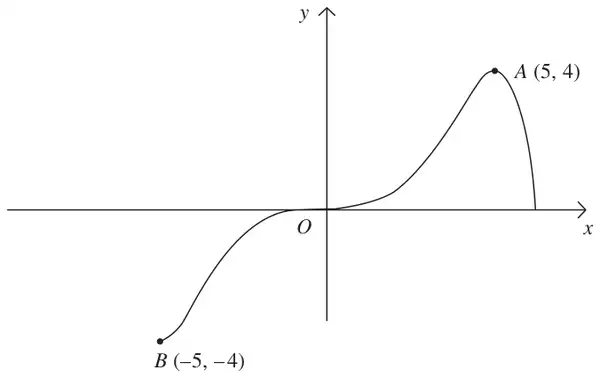
Figure 1 shows a sketch of the curve with equation \(y = \mathrm{f}(x)\).
The curve passes through the origin \(O\) and the points \(A(5, 4)\) and \(B(-5, -4)\).
In separate diagrams, sketch the graph with equation
(a) \(y = |\mathrm{f}(x)|\), (3)
(b) \(y = \mathrm{f}(|x|)\), (3)
(c) \(y = 2\mathrm{f}(x + 1)\). (4)
On each sketch, show the coordinates of the points corresponding to \(A\) and \(B\).
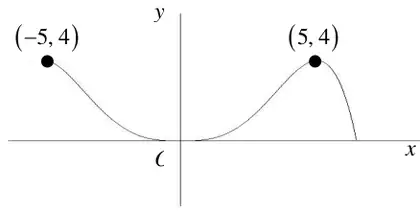
| Scheme | Marks |
|---|---|
| Shape | B1 |
| \((5, 4)\) | B1 |
| \((-5, 4)\) | B1 |
| (3) |
| Scheme | Marks |
|---|---|
| For the purpose of marking this paper, the graph is identical to (a) | |
| Shape | B1 |
| \((5, 4)\) | B1 |
| \((-5, 4)\) | B1 |
| (3) |
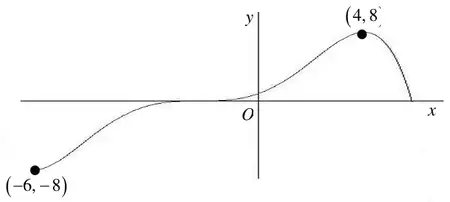
| Scheme | Marks |
|---|---|
| General shape – unchanged | B1 |
| Translation to left | B1 |
| \((4, 8)\) | B1 |
| \((-6, -8)\) | B1 |
| (4) | |
| (10 marks) |
Notes
In all parts of this question ignore any drawing outside the domains shown in the diagrams above.