
C2 June 2018 Q9
9.
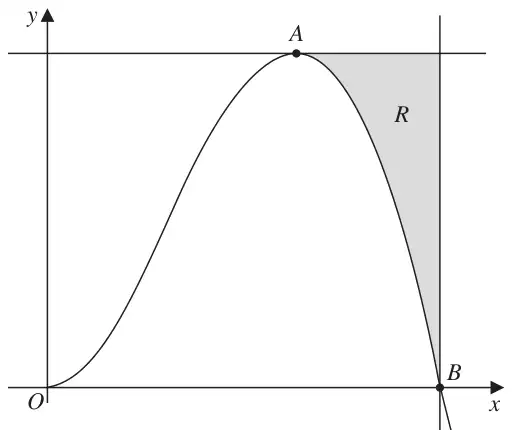
Figure 3 shows a sketch of part of the curve with equation\[y = 7x^2(5 - 2\sqrt{x}), \qquad x \geqslant 0\]The curve has a turning point at the point \(A\), where \(x > 0\), as shown in Figure 3.
The curve crosses the \(x\)-axis at the point \(B\), as shown in Figure 3.
The finite region \(R\), shown shaded in Figure 3, is bounded by the curve, the line through \(A\) parallel to the \(x\)-axis and the line through \(B\) parallel to the \(y\)-axis.
| Scheme | Marks |
|---|---|
| \(\dfrac{\mathrm{d}y}{\mathrm{d}x} = 70x - 35x^{\frac{3}{2}}\) | M1A1 |
| Put \(\dfrac{\mathrm{d}y}{\mathrm{d}x} = 0\) to give \(70x - 35x^{\frac{3}{2}} = 0\) so \(x^{\frac{1}{2}} = 2\) | M1 |
| \(x = 4\) \(y = 112\) | A1 A1 |
| (5) |
Notes
M1: Attempt at differentiation after multiplying out - may be awarded for \(70x\) term correct
(If product rule is used it must be of correct form i.e. \(\dfrac{\mathrm{d}y}{\mathrm{d}x} = 7x^2\left(-2kx^{k-1}\right) + 14x(5 - 2x^k)\) )
A1: the derivative must be completely correct but may be unsimplified
For product rule this is \(\dfrac{\mathrm{d}y}{\mathrm{d}x} = 7x^2\left(-x^{-\frac{1}{2}}\right) + 14x(5 - 2\sqrt{x})\)
M1: uses derivative = 0 to find \(x^k =\) or \(x =\) with correct work for their equation (even without fractional powers)
A1: obtains \(x = 4\) then
A1: for \(y = 112\) (may be credited if seen in part (a) or in part(c))
| Scheme | Marks |
|---|---|
| (Way 1) When \(y = 0\), \(35x^2 = 14x^{\frac{5}{2}}\) and \(x^{\frac{1}{2}} = \dfrac{35}{14}\) or \(5 = 2\sqrt{x}\) so \(\sqrt{x} = \dfrac{5}{2}\) | M1 |
| \(x = \dfrac{25}{4}\) | A1 |
| (2) | |
| (Way 2) When \(y = 0\), \(35x^2 = 14x^{\frac{5}{2}}\) so \(1225x^4 = 196x^5\) or \(5 = 2\sqrt{x}\) so \(25 = 4x\) | M1 |
| \(x = \dfrac{25}{4}\) or \(x = \dfrac{1225}{196}\) | A1 |
| (2) |
Notes
Way 1 (Dividing first)
M1: Puts \(y = 0\) and obtains expression of the form \(x^k = A\) (where \(k\) is not equal to 1) after correct algebra for their equation (may be a sign slip)
A1: Obtains \(x = 6.25\) or equivalent correct answer
Way 2 (dealing with fractional power first i.e. Squaring)
M1: Puts \(y = 0\) and squares each term correctly for their equation obtaining expression of the form \(A^2x^m = B^2x^n\) after correct algebra
A1: Obtains \(x = 6.25\) or equivalent correct answer
| Scheme | Marks |
|---|---|
| Way 1 \(\displaystyle\int 35x^2 - 14x^{\frac{\text{"}5\text{"}}{2}}\,\mathrm{d}x = \frac{35}{3}x^3 - \frac{14x^{\frac{\text{"}7\text{"}}{2}}}{\frac{\text{"}7\text{"}}{2}}\ (+c)\) | M1A1ft |
| \(\left[\dfrac{35}{3}x^3 - 4x^{\frac{7}{2}}\right]_4^{\frac{25}{4}} = 406.901.. - 234.667 = 172.23\) | dM1 |
| Hence Area \(= \text{"}\textit{their } 112 \times \left(6\tfrac{1}{4} - 4\right)\text{"} - \text{"}172.23\text{"}\) or “252” – “ 172.23” | ddM1 |
| 79.77 | A1 |
| (5) | |
| Way 2 \(\displaystyle\int \text{"}112\text{"} - \{35x^2 - 14x^{\frac{5}{2}}\}\,\mathrm{d}x = (112x) - \frac{35}{3}x^3 + \frac{14x^{\frac{7}{2}}}{\frac{7}{2}}\ (+c)\) | M1A1ft |
| \(\left[(112x) - \left(\dfrac{35}{3}x^3 - 4x^{\frac{7}{2}}\right)\right]_{\text{"}4\text{"}}^{\text{"}\frac{25}{4}\text{"}}\) with correct use of limits | dM1 |
| Integrated their 112 to give \(112x\) with correct use of limits | ddM1 |
| 79.77 | A1 |
| (5) | |
| [12] |
Notes
Way 1
M1: Correct integration of one of their terms – e.g. see \(x^2\) term integrated correctly (not just raised power)
A1ft: completely correct integral for their power which must have been a fraction (may be unsimplified)
dM1: (dependent on previous M) substituting their 25/4 and their 4 and subtracting
ddM1 (depends on both method marks) Correct method to obtain shaded area so their rectangle minus their area under curve
A1: Accept answers which round to 79.77
Way 2
M1: Attempt at integration – \(x^2\) term integrated correctly
A1ft: completely correct integral for second and their third terms (provided one has a fractional power) (ignore sign errors) (may be unsimplified)
dM1: (dependent on previous M) substituting their 25/4 and their 4 and subtracting (either way)
ddM1 (depends on both method marks) Correct method to obtain shaded area so their 112 integrated correctly and correct signs for the other two terms in the integrand
A1: Accept answers which round to 79.77
Answer with no working – send to review
If they have the wrong fractional power on their second term after expansion in part (a) (usually 3/2), all the method marks are available throughout the question and the A1ft is available in (c). The A mark in part (b) may also be accessible. Maximum score is likely to be 8/12
If they have the trivial power 1 on their second term, then two method marks are available in (a) and three method marks are available in part (c) Maximum score is likely to be 5/12