
June 2023 Statistics Q2
2. Fred and Nadine are investigating whether there is a linear relationship between Daily Mean Pressure, \(p\) hPa, and Daily Mean Air Temperature, \(t\ ^\circ\mathrm{C}\), in Beijing using the 2015 data from the large data set.
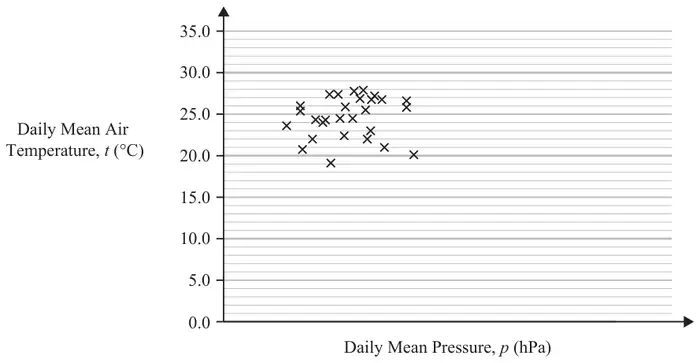
Fred randomly selects one month from the data set and draws the scatter diagram in Figure 1 using the data from that month.
The scale has been left off the horizontal axis.
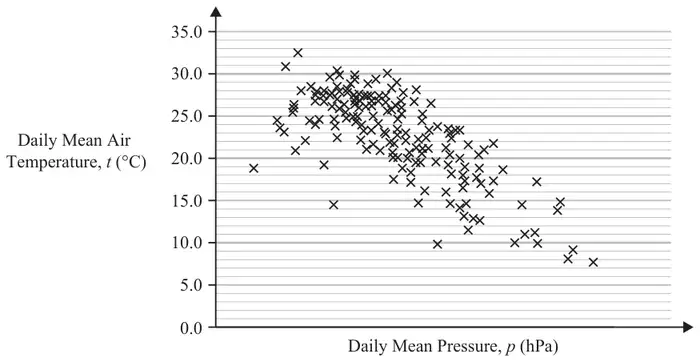
Nadine chooses to use all of the data for Beijing from 2015 and draws the scatter diagram in Figure 2.
She uses the same scales as Fred.
| Scheme | Marks | AO |
|---|---|---|
| No (correlation)/weak (correlation) | B1 | 1.1b |
| (1) |
Notes
B1: correct description of correlation (oe) (ignore reference to positive/negative) condone neutral
| Scheme | Marks | AO |
|---|---|---|
| (Negative correlation…) As p(ressure) increases, t(emperature) decreases. | B1 | 2.2b |
| (1) |
Notes
B1: correct inference, allow equivalent statements.
Negative correlation on its own is B0. Inversely proportional on its own is B0.
| Scheme | Marks | AO |
|---|---|---|
| 990 to 1040 (hPa) | B1 | 3.4 LDS |
| (1) |
Notes
B1: an answer in the range 990 to 1040 inclusive (ignore units)
| Scheme | Marks | AO |
|---|---|---|
| Daily mean wind speed (Beaufort) is a qualitative variable. | B1 | 2.4 LDS |
| (1) | ||
| (4 marks) |
Notes
B1: correct explanation that in the LDS, wind speed (Beaufort) is qualitative/not quantitative
Allow e.g. ‘categorical’, e.g. ‘given in words’, e.g. ‘wind speed is (always) light’
Do not allow ‘not continuous’ on its own.