
June 2023 Statistics Q1
1. The histogram and its frequency polygon below give information about the weights, in grams, of 50 plums.
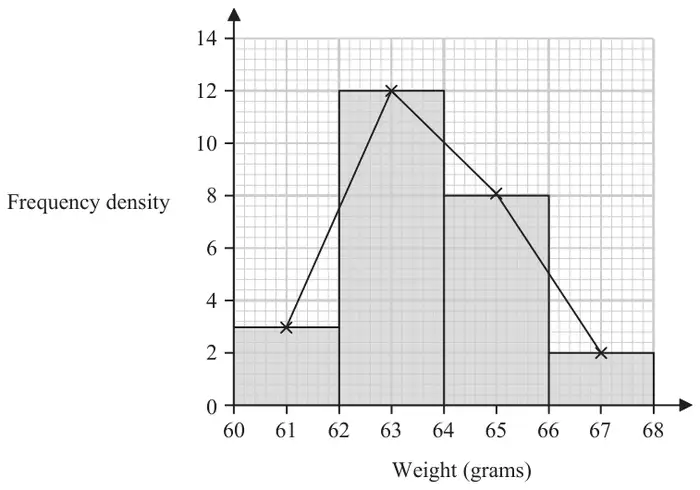
Later it was discovered that the scales used to weigh the plums were broken.
Each plum actually weighs 5 grams less than originally thought.
| Scheme | Marks | AO |
|---|---|---|
| \(61 \times (2 \times 3),\quad 63 \times (2 \times 12),\quad 65 \times (2 \times 8),\quad 67 \times (2 \times 2)\) | M1 | 2.1 |
| \(\dfrac{61 \times (2 \times 3) + 63 \times (2 \times 12) + 65 \times (2 \times 8) + 67 \times (2 \times 2)}{50} = 63.72\ *\) | A1*cso | 1.1b |
| (2) |
Notes
M1: at least 3 correct products seen (oe) Allow any 3 from 366, 1512, 1040, 268
A1*cso: correct expression for mean (which may be seen in stages) and given answer. \(\frac{3186}{50} = 63.72\) on its own is M0A0, but \(\frac{3186}{50} = 63.72\) following all 4 correct products seen can score M1A1
SC: B2: \(\dfrac{61 \times 3 + 63 \times 12 + 65 \times 8 + 67 \times 2}{25} = 63.72\ *\) scores M1A1 on epen
| Scheme | Marks | AO |
|---|---|---|
| \(\sqrt{\dfrac{61^2 \times 6 + 63^2 \times 24 + 65^2 \times 16 + 67^2 \times 4}{50} - 63.72^2}\) | M1 | 1.1b |
| \(= \sqrt{2.5216} = 1.58795\ldots\) = awrt 1.59 | A1 | 1.1b |
| (2) |
Notes
M1: correct expression for the standard deviation including root
Allow equivalent complete methods e.g.
\(\sqrt{\dfrac{6(61 - 63.72)^2 + 24(63 - 63.72)^2 + 16(65 - 63.72)^2 + 4(67 - 63.72)^2}{50}}\)
NB: \(\sum fx^2 = 203138\)
A1: awrt 1.59 (allow \(s\) = awrt 1.60)
Correct answer with no incorrect working scores 2 out of 2
SC: B2: \(\sqrt{\dfrac{61^2 \times 3 + 63^2 \times 12 + 65^2 \times 8 + 67^2 \times 2}{25} - 63.72^2}\) = awrt 1.59 scores M1A1 on epen
| Scheme | Marks | AO |
|---|---|---|
No effect (oe) since…e.g.
| B1 | 2.4 |
| (1) | ||
| (5 marks) |
Notes
B1: correct statement and correct explanation