
June 2022 Statistics Q4
4. Jiang is studying the variable Daily Mean Pressure from the large data set.
He drew the following box and whisker plot for these data for one of the months for one location using a linear scale but
- he failed to label all the values on the scale
- he gave an incorrect value for the median
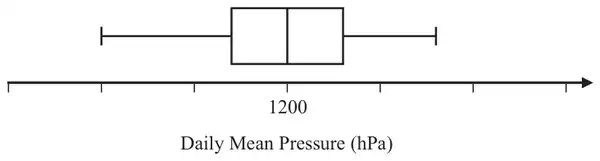
Using your knowledge of the large data set, suggest a suitable value for
(a) the median, (1)
(b) the range. (1)
(You are not expected to have memorised values from the large data set. The question is simply looking for sensible answers.)
| Scheme | Marks | AO |
|---|---|---|
| Accept 990 to 1030 inclusive | B1 | 1.1b |
| (1) |
Notes
B1 (Median pressures usually around 1000~1020) [LDS mark]
| Scheme | Marks | AO |
|---|---|---|
| Any range between 10 and 50 inclusive | B1 | 1.1b |
| (1) | ||
| (2 marks) |
Notes
B1 Any answer in this range [LDS mark]
Allow answers in the form \(a \sim b\) where \(|b - a|\) is between 10 and 50
Also allow the case where both \(a\) and \(b\) are in [10, 50]