
June 2024 Statistics Q1
1. A coach recorded the heights of some adult rugby players and found the following summary statistics.
\[\begin{aligned} \text{Median} &= 1.85\ \text{m} \\ \text{Range} &= 0.28\ \text{m} \\ \text{Interquartile range} &= 0.11\ \text{m} \end{aligned}\]The coach also noticed that
- the height of the shortest player is 1.72 m
- 25% of the players’ heights are below the height of a player whose height is 1.81 m
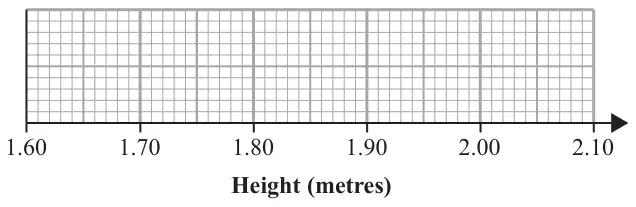
Draw a box and whisker plot to represent this information on the grid below. (4)
| Scheme | Marks | AO |
|---|---|---|
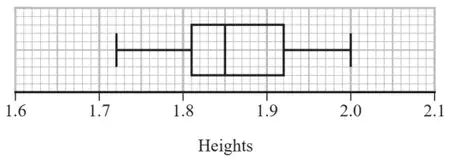 | B1 B1ft B1 B1ft | 2.2a 1.1b 2.2a 1.1b |
| (4 marks) |
Notes
1st B1 for a box with 2 whiskers (one at each end)
with median at 1.85 and lower quartile at 1.81
do not allow median = upper quartile [=1.85]
2nd B1ft for 1.92 plotted as the upper quartile (must be right hand end of box)
or for plotting an IQR = 0.11, i.e. their upper quartile at “1.81” + 0.11
3rd B1 for lower whisker ending at 1.72 must be attached to whisker
4th B1ft for upper whisker ending 2.0 must be attached to whisker
or for plotting a range of 0.28 i.e. their upper whisker ending at “1.72” + 0.28
for ft condone maximum and/or minimum plotted as outliers by * or ×