
October 2021 Paper 1 Q11
11.
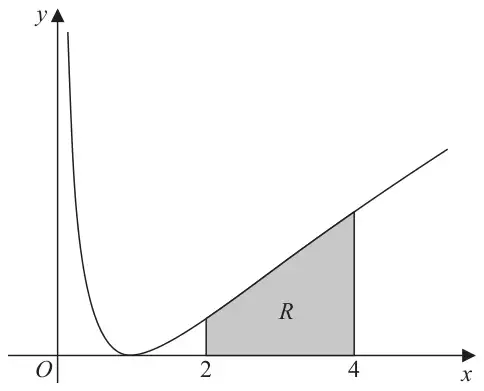
Figure 2 shows a sketch of part of the curve with equation
\[y = (\ln x)^2 \qquad x \gt 0\]The finite region \(R\), shown shaded in Figure 2, is bounded by the curve, the line with equation \(x = 2\), the \(x\)-axis and the line with equation \(x = 4\)
The table below shows corresponding values of \(x\) and \(y\), with the values of \(y\) given to 4 decimal places.
| \(x\) | 2 | 2.5 | 3 | 3.5 | 4 |
|---|---|---|---|---|---|
| \(y\) | 0.4805 | 0.8396 | 1.2069 | 1.5694 | 1.9218 |
| Scheme | Marks | AO |
|---|---|---|
| \(h = 0.5\) | B1 | 1.1b |
| \(A \approx \dfrac{1}{2} \times \dfrac{1}{2}\{0.4805 + 1.9218 + 2(0.8396 + 1.2069 + 1.5694)\}\) | M1 | 1.1b |
| = 2.41 | A1 | 1.1b |
| (3) |
Notes
B1: Correct strip width. May be implied by \(\dfrac{1}{2} \times \dfrac{1}{2}\{\ldots\}\) or \(\dfrac{1}{4} \times \{\ldots\}\)
M1: Correct application of the trapezium rule.
Look for \(\dfrac{1}{2} \times \text{``}h\text{''}\{0.4805 + 1.9218 + 2(0.8396 + 1.2069 + 1.5694)\}\) condoning slips in the digits.
The bracketing must be correct but it is implied by awrt 2.41
A1: 2.41 only. This is not awrt
| Scheme | Marks | AO |
|---|---|---|
| \(\displaystyle\int (\ln x)^2\,\mathrm{d}x = x(\ln x)^2 - \int x \times \dfrac{2\ln x}{x}\,\mathrm{d}x\) | M1 A1 | 3.1a 1.1b |
| \(\displaystyle = x(\ln x)^2 - 2\int \ln x\,\mathrm{d}x = x(\ln x)^2 - 2\left(x\ln x - \int \mathrm{d}x\right)\) \(\displaystyle = x(\ln x)^2 - 2\int \ln x\,\mathrm{d}x = x(\ln x)^2 - 2x\ln x + 2x\) | dM1 | 2.1 |
| \(\displaystyle\int_2^4 (\ln x)^2\,\mathrm{d}x = \left[x(\ln x)^2 - 2x\ln x + 2x\right]_2^4\) \(= 4(\ln 4)^2 - 2 \times 4\ln 4 + 2 \times 4 - \left(2(\ln 2)^2 - 2 \times 2\ln 2 + 2 \times 2\right)\) \(= 4(2\ln 2)^2 - 16\ln 2 + 8 - 2(\ln 2)^2 + 4\ln 2 - 4\) | ddM1 | 2.1 |
| \(= 14(\ln 2)^2 - 12\ln 2 + 4\) | A1 | 1.1b |
| (5) | ||
| (8 marks) |
Notes
M1: Attempts parts the correct way round to achieve \(\displaystyle\alpha x(\ln x)^2 - \beta\int \ln x\,\mathrm{d}x\) o.e.
May be unsimplified (see scheme). Watch for candidates who know or learn \(\displaystyle\int \ln x\,\mathrm{d}x = x\ln x - x\)
who may write \(\displaystyle\int (\ln x)^2\,\mathrm{d}x = \int (\ln x)(\ln x)\,\mathrm{d}x = \ln x(x\ln x - x) - \int \dfrac{x\ln x - x}{x}\,\mathrm{d}x\)
A1: Correct expression which may be unsimplified
dM1: Attempts parts again to (only condone coefficient errors) to achieve \(\alpha x(\ln x)^2 - \beta x\ln x \pm \gamma x\) o.e.
ddM1: Applies the limits 4 and 2 to an expression of the form \(\pm\alpha x(\ln x)^2 \pm \beta x\ln x \pm \gamma x\), subtracts and applies \(\ln 4 = 2\ln 2\) at least once. Both M’s must have been awarded
A1: Correct answer
It is possible to do \(\displaystyle\int (\ln x)^2\,\mathrm{d}x\) via a substitution \(u = \ln x\) but it is very similar.
M1 A1, dM1: \(\displaystyle\int u^2\mathrm{e}^u\,\mathrm{d}u = u^2\mathrm{e}^u - \int 2u\mathrm{e}^u\,\mathrm{d}u, = u^2\mathrm{e}^u - 2u\mathrm{e}^u \pm 2\mathrm{e}^u\)
ddM1: Applies appropriate limits and uses \(\ln 4 = 2\ln 2\) at least once to an expression of the form \(u^2\mathrm{e}^u - \beta u\mathrm{e}^u \pm \gamma\mathrm{e}^u\) Both M’s must have been awarded